
What Does It Really Cost to Acquire an App User in 2026?
Mobile app companies are burning through budgets faster than ever, yet many still have no clear picture of what each new user actually costs them. The global average cost per install (CPI) across all app categories reached $3.91 in 2024, but that headline number hides enormous variation by vertical, platform, and geography (Adjust, 2024). Gaming apps can see CPIs as low as $0.80, while finance and insurance apps routinely pay $20 or more per install. If your team is optimizing for installs without understanding the full cost of quality user acquisition, you are likely wasting a significant portion of your paid budget.
In this guide, you will learn exactly what drives app user acquisition cost, how to benchmark your spend against industry data, which strategies reliably lower your cost per acquisition (CPA) without sacrificing quality, and what the landscape will look like heading into 2026 and 2027.
Key Takeaways
- The average cost per install for iOS apps in the US is $3.50 to $6.00, with finance and e-commerce verticals exceeding $15 CPI (Adjust, 2024).
- Only 32% of app marketers say they consistently hit their target cost per acquisition across paid channels (AppsFlyer, 2024).
- Apps that use creative testing and audience segmentation together reduce blended CPA by an average of 30 to 40% compared to single-channel approaches (AppsFlyer, 2024).
- Organic installs, driven by App Store Optimization (ASO), cost effectively $0 per install in media spend and convert at 3x the rate of paid installs (Sensor Tower, 2024).
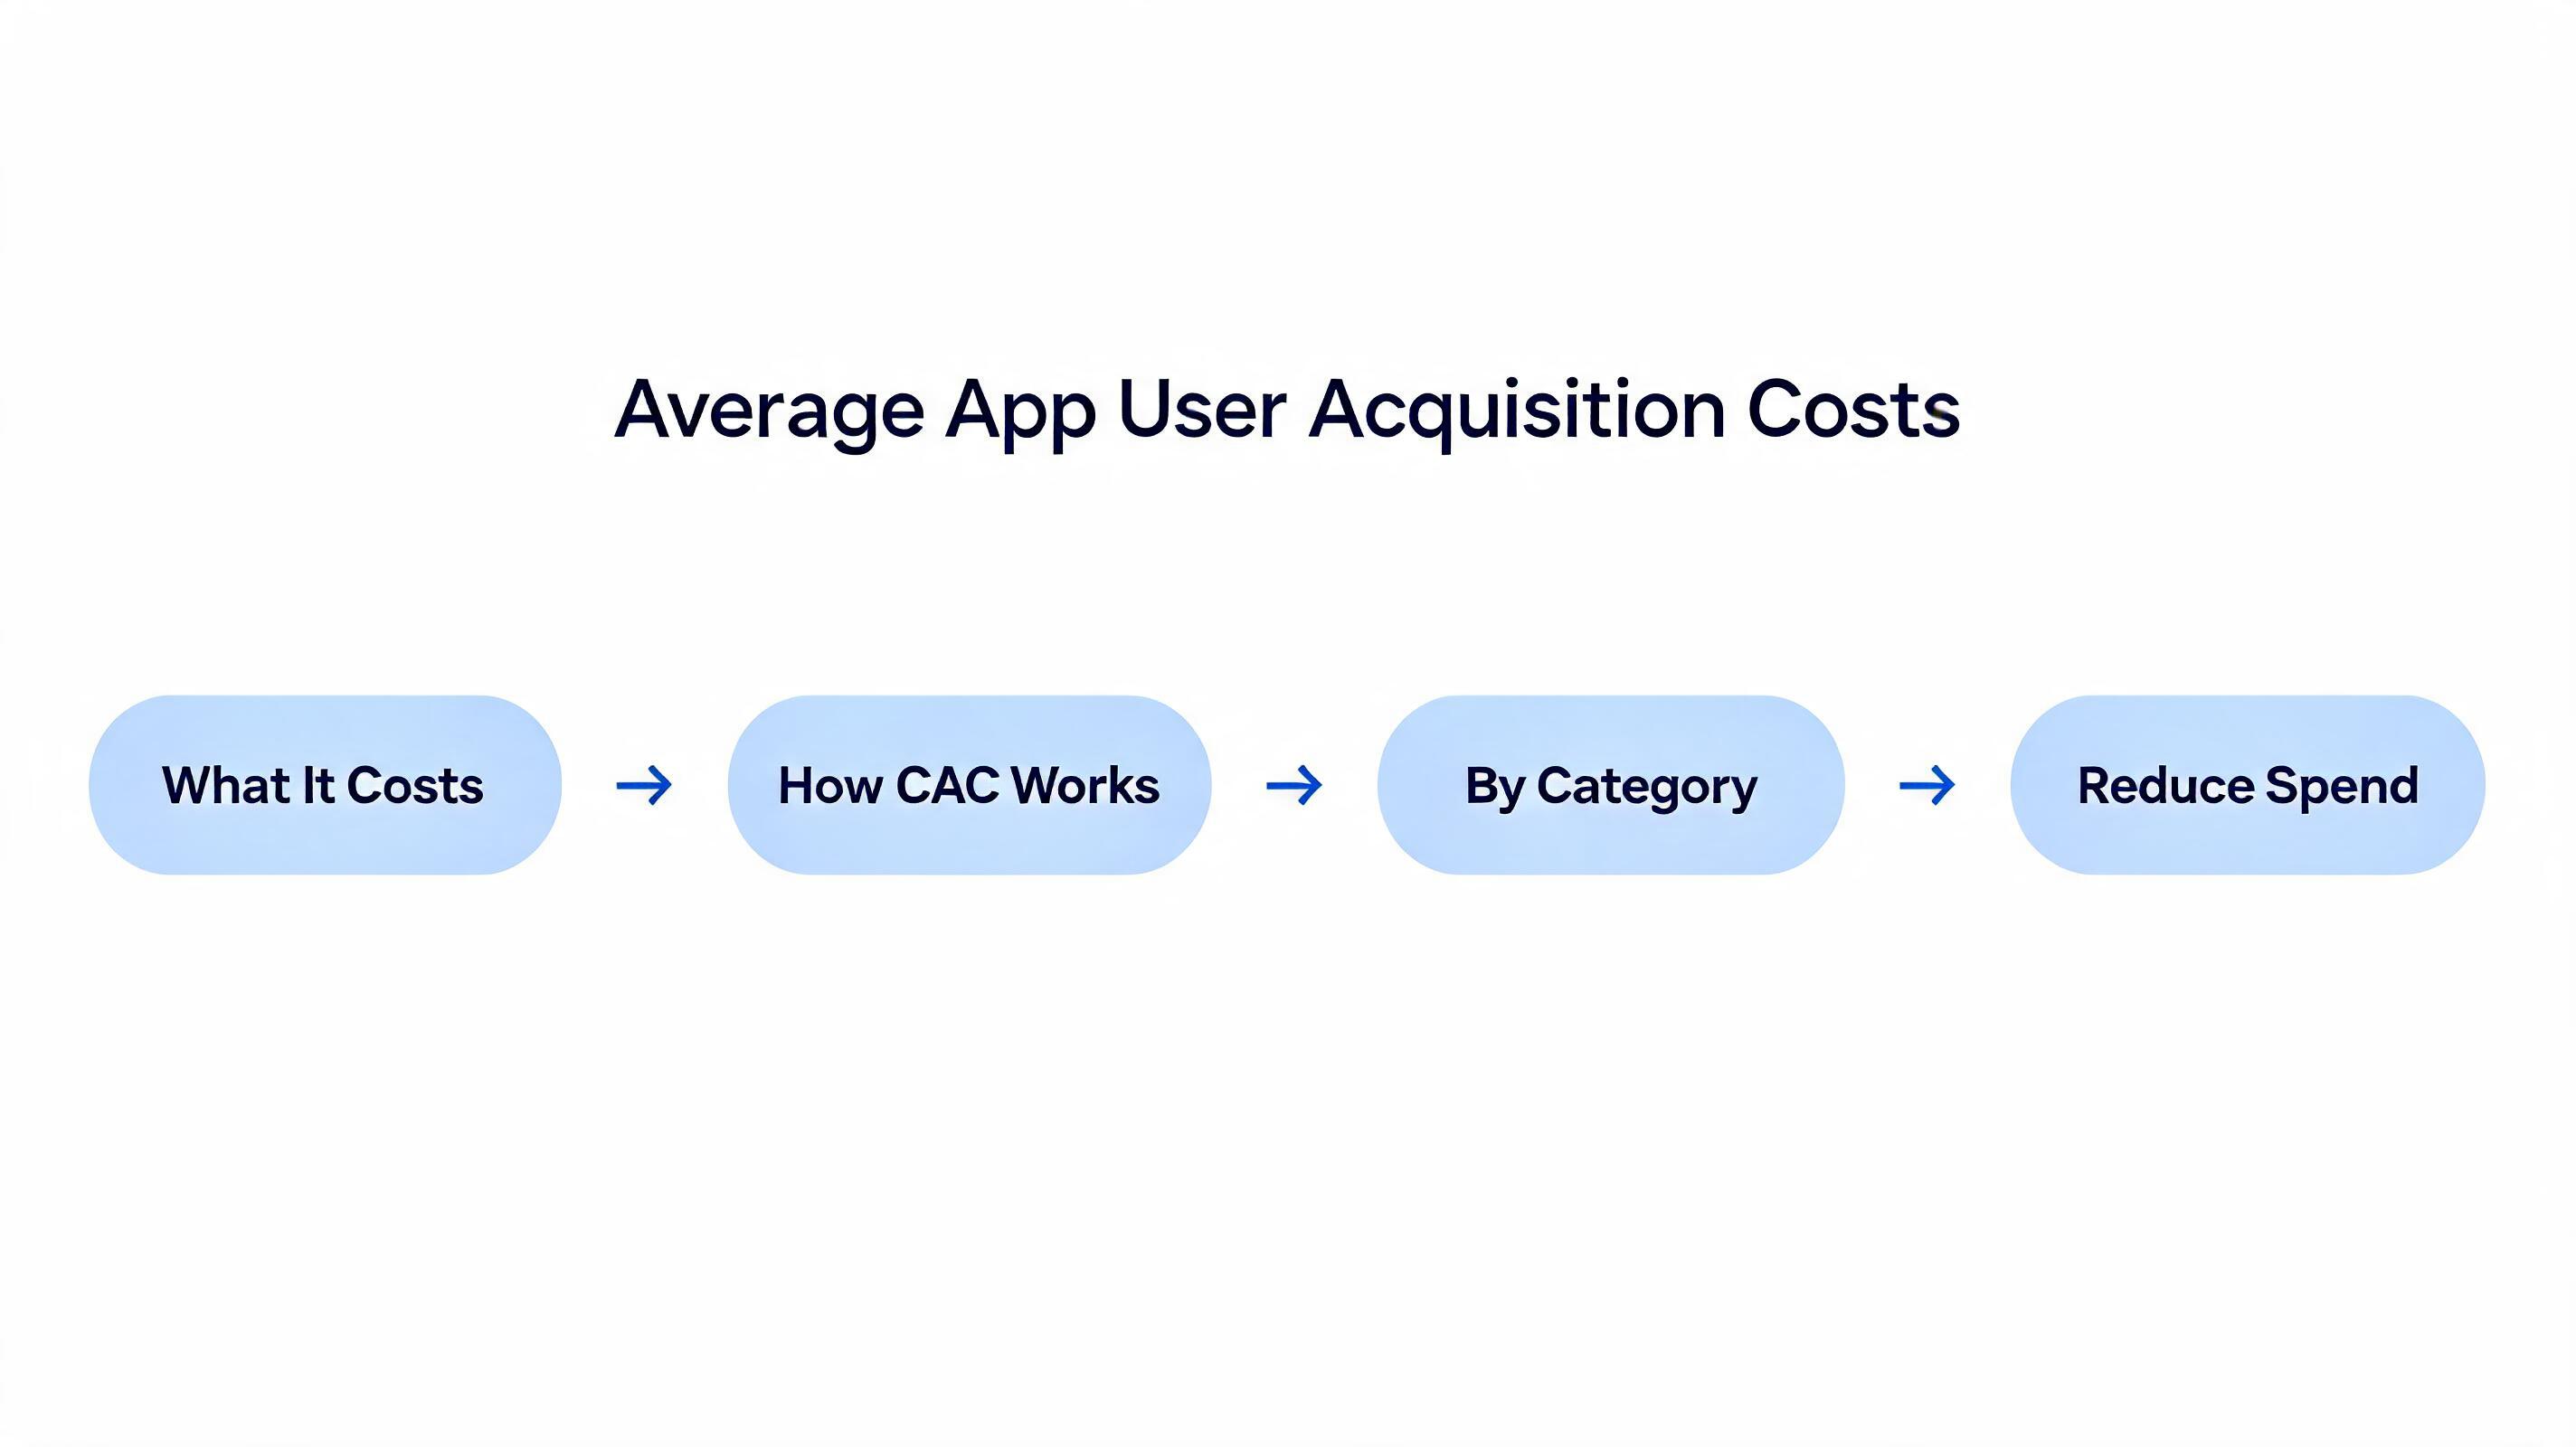
What Is App User Acquisition Cost and How Is It Calculated?
App user acquisition cost is the total spend required to bring one new user into your app, and understanding its components is the first step to controlling it. At its simplest, cost per acquisition equals total marketing spend divided by the number of new users acquired in a given period. But that clean formula obscures the complexity underneath.
Most mobile marketers track several related metrics simultaneously. Cost per install (CPI) measures raw download efficiency. Cost per registration (CPR) captures the first meaningful action. Cost per paying user (CPPU) connects spend directly to revenue. Each metric tells a different story, and relying on only one will mislead your optimization decisions.
Consider a fintech app running Apple Search Ads in the US. The CPI might look healthy at $4.50, but if only 8% of installs ever complete account verification, the true CPR balloons to $56.25. If 15% of registered users become paying customers, the CPPU climbs further to $375. Suddenly a "cheap" install looks very expensive against a customer lifetime value (LTV) of $200.
Platform matters enormously. iOS users in the US generate 1.5x to 2x the lifetime value of Android users on average, which is why iOS CPIs are consistently higher (Sensor Tower, 2024). Advertisers willingly pay more per iOS install precisely because the downstream economics justify it. Android campaigns, especially on Google UAC, reach a broader audience at lower CPIs but with more noise in conversion quality.
Channel mix also shapes blended acquisition cost significantly. Paid social (Meta, TikTok) typically delivers the highest volume but also the most volatility post-iOS 14.5 privacy changes. Apple Search Ads captures high-intent users at the moment of search. Programmatic networks offer scale but require careful fraud monitoring. Each channel has a different CPI, but more importantly, each has a different downstream conversion rate that changes your true CPA.
A real-world example: a mid-market fitness app paying $2.10 CPI on a programmatic network discovered through cohort analysis that those users had a 90-day retention rate of only 4%, compared to 22% for Apple Search Ads users paying $5.80 CPI. The programmatic channel looked cheaper but cost nearly three times more per retained user. Knowing your acquisition cost at every funnel stage, not just the install, is the foundation of intelligent budget allocation.
How Can Mobile App Companies Actually Reduce Their User Acquisition Costs?
Reducing app user acquisition cost is not about spending less. It is about spending smarter across creative, targeting, and channel strategy. Companies that consistently hit efficient CPA targets do five things differently from those that struggle.
Step 1: Establish a single source of truth for attribution. Before optimizing spend, you need reliable data. Implement a mobile measurement partner (MMP) such as AppsFlyer or Adjust from day one. Configure SKAdNetwork postbacks correctly for iOS and set meaningful conversion value schemas tied to revenue events, not just installs. Without accurate attribution, every optimization decision is guesswork.
Step 2: Build a creative testing machine. Creative quality is now the single largest lever for reducing CPIs on Meta and TikTok. Run a minimum of 8 to 12 creative variants per campaign, testing different hooks, formats (static, video, UGC), and value propositions. Promote winners quickly and kill losers within 72 hours. Teams that systematize creative iteration see 20 to 35% CPI reductions within 60 days of implementing a structured testing calendar.
Step 3: Invest heavily in App Store Optimization (ASO). Every incremental improvement in your store listing conversion rate directly reduces your effective paid CPA. If your listing converts 35% of page visitors versus a competitor converting 25%, you are getting 40% more installs from the same paid traffic. Optimize your icon, screenshots, app preview video, title, and subtitle for both conversion and keyword ranking. This compounds over time in a way paid spend never does.
Step 4: Segment audiences by predicted LTV, not demographics. Use first-party behavioral data from your existing user base to build lookalike audiences on Meta and Google. Segment those lookalikes by engagement depth (users who completed onboarding versus those who made a purchase) rather than basic demographics. Higher-quality seed audiences produce lookalikes with measurably better downstream conversion rates.
Step 5: Diversify channels based on payback period targets. If your target payback period is 90 days, align channel mix to that constraint. Apple Search Ads typically delivers faster payback for intent-driven categories. Paid social scales volume but often requires 120 to 180 days to fully evaluate quality. Knowing which channels fit your financial model prevents over-investment in channels that look efficient at install but destroy LTV.
Our team at ApsteQ works with mobile app companies to build acquisition systems that address all five of these levers simultaneously. If you are curious how a structured approach applies to your category, explore our app marketing services to see how we drive down blended CPA for apps at every stage of growth.
App User Acquisition Cost Benchmarks by Vertical and Platform
Benchmarking your acquisition costs against industry data is essential because "expensive" and "efficient" are entirely relative to your category. The data tells a clear story: vertical, platform, and geography create wildly different cost environments, and marketers who do not know their category benchmarks routinely misallocate budget.
Key benchmark findings from current research include the following:
- Gaming apps have the lowest average CPI at $1.20 to $2.50 on Android, but post-install engagement quality is often lower than other verticals (Adjust, 2024).
- Finance and insurance apps face the highest CPIs, ranging from $12 to $30+ in the US on iOS, reflecting both advertiser competition and the high LTV of acquired customers (Sensor Tower, 2024).
- Health and fitness apps average $4.00 to $8.00 CPI on iOS in the US, with strong seasonal spikes in January and late summer (Statista, 2024).
- E-commerce and shopping apps typically see $3.50 to $7.00 CPI with conversion-to-purchase rates of 3 to 5% within 30 days (AppsFlyer, 2024).
- Subscription apps across categories report a median cost per subscriber of $18 to $35, with the top quartile achieving under $12 through strong ASO and referral programs (Sensor Tower, 2024).
| App Vertical | Avg iOS CPI (USD) | Avg Android CPI (USD) | Typical 30-Day Retention (%) |
|---|---|---|---|
| Gaming (Casual) | $2.50 | $1.20 | 12% |
| Health and Fitness | $6.00 | $3.50 | 21% |
| E-Commerce / Shopping | $5.50 | $3.20 | 18% |
| Finance and Fintech | $22.00 | $14.00 | 28% |
| Subscription / SaaS Apps | $9.00 | $5.50 | 35% |
The retention column is as important as the CPI columns. Finance apps pay the most per install but retain users at nearly 3x the rate of casual games. When you calculate cost per retained user at 30 days, the finance vertical is often more efficient despite the sticker shock of the raw CPI. This is why smart acquisition teams always evaluate CPI in context of funnel conversion and retention data, never in isolation.
What Mistakes Are Destroying Your App Acquisition Efficiency?
Even well-funded mobile app companies make systematic errors that inflate acquisition costs unnecessarily. Identifying and eliminating these mistakes often delivers faster ROI improvement than launching new channels or increasing budgets.
Mistake 1: Optimizing for installs instead of downstream events. This is the most common and costly mistake in mobile UA. Running campaigns optimized for installs will find you the cheapest clicks and store page visits, which rarely correlate with users who pay, subscribe, or retain. Switch campaign optimization events to registration completion, tutorial finish, or first in-app purchase for any mature campaign with enough conversion data. Most MMPs recommend a minimum of 50 optimization events per week before switching from install optimization.
Mistake 2: Ignoring ad fraud. Mobile ad fraud costs the industry billions annually. Click injection, SDK spoofing, and device farms silently inflate your install numbers while delivering zero real users. Invalid traffic affected an estimated 10 to 15% of mobile ad spend in 2024 (AppsFlyer, 2024). Implement fraud protection through your MMP, set strict post-install event verification, and regularly audit your network partners for anomalous install-to-event ratios.
Mistake 3: Neglecting creative refresh cycles. Ad fatigue on paid social is real and measurable. When CPMs rise and click-through rates fall without corresponding changes in bid competition, your creative is exhausted. Many teams wait too long to refresh, sometimes running the same top creative for 60 to 90 days past its peak efficiency window. Monitor creative frequency and CTR weekly, and plan refreshes every 3 to 4 weeks for high-volume campaigns.
Mistake 4: Treating all geographies as equal. US CPIs are among the highest in the world. Teams that run global campaigns with a flat budget allocation without geo-specific bid strategies consistently over-pay for US installs while under-bidding in high-value international markets. Segment campaigns by geo tier (Tier 1, Tier 2, Tier 3) and apply separate bid strategies and creative variations for each.
Mistake 5: Skipping the retention side of the acquisition equation. Acquiring users cheaply and then losing them to poor onboarding is equivalent to pouring water into a bucket with a hole. The average app loses 77% of its daily active users within the first three days after install (Statista, 2024). Investing in onboarding flow optimization and early push notification strategy directly improves the downstream value of every dollar spent on acquisition.
Avoiding these mistakes requires both technical infrastructure and strategic discipline. Our app marketing specialists at ApsteQ conduct acquisition audits that identify exactly where your budget is leaking before building a corrected strategy.
How Will App User Acquisition Costs Evolve in 2026 and 2027?
The mobile acquisition landscape is entering a period of significant structural change, and companies that anticipate these shifts will gain meaningful competitive advantage on cost efficiency.
Privacy-first measurement will become the industry standard. Apple's ATT framework already transformed iOS acquisition, and Google's Privacy Sandbox is rolling out equivalent changes for Android. By 2026, the majority of mobile ad spend will operate under some form of privacy-preserving measurement, using aggregated rather than user-level data. Teams investing now in probabilistic modeling, incrementality testing, and media mix modeling will be better positioned to allocate budgets efficiently when deterministic attribution becomes less available.
AI-powered creative generation will compress CPIs for agile teams. Generative AI tools for video, static, and playable ad creation are reducing creative production costs by 50 to 70% for early adopters. This matters for acquisition cost because teams that can produce and test more creative variations faster will find efficient angles before competitors. By 2027, creative testing velocity, not budget size, may be the primary differentiator for CPI performance.
Alternative app distribution channels will create new acquisition cost dynamics. The EU's Digital Markets Act has forced Apple to allow alternative app stores in Europe, and similar regulatory pressure is building globally. By 2026 to 2027, mobile app companies may have meaningful user acquisition volume flowing through channels outside the App Store and Google Play, each with different cost structures and conversion patterns.
Retention-based bidding will replace install-based bidding at scale. Ad platforms including Meta and Google are expanding their value-based bidding options, allowing advertisers to bid based on predicted LTV rather than install probability. Advertisers using value-based bidding on Meta report 20 to 40% improvement in return on ad spend (AppsFlyer, 2024). As these tools mature through 2026, the gap between teams using LTV-aware bidding and those still optimizing for installs will widen significantly.
What Do App User Acquisition Costs Look Like in 2026?
The honest answer is that a single average is useless: Apple Ads cost per tap ranges from $0.24 to $14.41 depending on category, a spread of nearly 60x. The global median sits at $0.92 and the top-15-category average at $2.25, rising to roughly $1.51 in Q4 as holiday advertisers bid up inventory. Benchmark against your own category and geography, never against the global mean.
| Category | Apple Ads cost per tap | What decides profitability |
|---|---|---|
| Sports | $14.41 | Only viable with high LTV or ad-supported scale |
| Finance & Fintech | $3.00 - $6.06 | Subscription LTV usually covers it |
| Medical & Health | $1.50 - $4.45 | Retention, not install cost |
| E-commerce | $1.20 - $3.00 | First-purchase rate |
| Productivity & Utilities | $0.80 - $2.50 | Freemium conversion |
| Hyper-casual games | $0.30 - $0.80 | Ad revenue per DAU |
Sources: AppTweak Apple Ads benchmarks 2026, Adapty (90 countries), Business of Apps.
Why Cost Per Install Is the Wrong Target
Cost per install is a means metric; cost per paying user is the one that maps to revenue. A $6 tap in fintech that converts at 60% into a subscriber worth $180 is a far better purchase than a $0.55 hyper-casual tap that never monetises. Three patterns move acquisition cost more reliably than bid tuning, from the accounts our team manages directly:
- Exact-match brand campaigns run 60-80% below category cost per tap. Defending your own app name is the cheapest install available, and it is the first line underfunded accounts cut.
- Broad match without negatives leaks budget indefinitely. Weekly search-term review typically recovers 15-30% of wasted spend in the first month.
- Creative moves cost more than bids do. Auctions price on relevance, so a higher tap-through rate lowers effective cost without touching a bid.
If you would rather have this run by a team that reports on cost per paying user rather than installs, that is how our mobile user acquisition engagement works, and the wider app marketing agency offering covers store visibility alongside it.
The real question is never "What is a good CPI?" but rather "What is a good cost per paying user?" Use the Break-Even ROAS Calculator to convert your gross margin into the maximum cost per install you can sustain. For subscription apps, model your payback period with the Subscription App LTV Calculator to see exactly how much you can afford to spend on day-1 acquisition.
Frequently Asked Questions
What is a good cost per install for a mobile app in the US?
A good cost per install depends heavily on your vertical and platform. For iOS in the US, a competitive CPI ranges from $2.50 for casual games to $22 for finance apps. The more meaningful benchmark is cost per paying user or cost per retained user at 30 days, which should be well below your customer lifetime value to sustain profitable growth.
How does iOS compare to Android in terms of user acquisition cost?
iOS user acquisition consistently costs 40 to 60% more than Android in the US, with iOS CPIs averaging $3.50 to $6.00 versus $1.80 to $3.50 for Android across most verticals (Adjust, 2024). However, iOS users typically generate higher LTV and better 90-day retention rates, making the higher CPI justifiable for most subscription and monetization models.
What channels deliver the lowest app user acquisition cost?
Organic installs driven by strong App Store Optimization have effectively zero media cost and convert at 3x the rate of paid installs (Sensor Tower, 2024). Among paid channels, Apple Search Ads frequently delivers the highest intent users at efficient CPAs for non-gaming apps. Paid social on Meta and TikTok offers volume but requires strong creative and robust fraud monitoring to maintain efficiency.
How can I reduce my app's blended cost per acquisition quickly?
The fastest path to CPA reduction combines creative testing acceleration with ASO improvements to your store listing conversion rate. Running 8 to 12 creative variants simultaneously and refreshing every 3 to 4 weeks typically yields 20 to 35% CPI reductions within 60 days. Simultaneously, improving your store page conversion rate by even 5 percentage points makes every paid traffic dollar work harder. Learn more about systematic approaches through our app marketing services.
Does ad fraud significantly impact app user acquisition costs?
Yes, ad fraud is a material drain on acquisition budgets. Invalid or fraudulent traffic affected an estimated 10 to 15% of mobile ad spend in 2024 (AppsFlyer, 2024). Implementing fraud protection through a mobile measurement partner and regularly auditing network partners for anomalous install-to-event conversion ratios can recover 10 to 15% of wasted spend, effectively lowering your real CPA without changing bids.
Conclusion: Building a Smarter App Acquisition Strategy
App user acquisition cost is not a fixed number you accept. It is a variable you control through the quality of your measurement infrastructure, creative strategy, channel mix, and retention investment. The companies winning on acquisition efficiency in 2025 share a common approach: they measure at every funnel stage, test creative relentlessly, and connect every spend decision to downstream LTV rather than surface-level install metrics.
- Calculate cost per retained user and cost per paying user, not just CPI.
- Benchmark against your specific vertical, not general app industry averages.
- Invest in ASO to reduce the effective cost of paid traffic.
- Refresh creative every 3 to 4 weeks to fight ad fatigue and rising CPMs.
- Audit for fraud regularly and segment campaigns by geography and platform.
- Prepare now for privacy-first measurement changes coming through 2026 and 2027.
If you want an expert team to audit your current acquisition cost structure and build a channel strategy calibrated to your LTV targets, book a free strategy call with the ApsteQ team today. We work exclusively with mobile app companies and bring benchmarked data from across the industry to every engagement.
Free download
The App UA Cost Report 2026
Real cost-per-install and cost-per-trial benchmarks by channel and category, so you know what you should be paying.
Get the Free Ebook Browse all free guides