App User Acquisition in 2026: What It Really Costs and How to Build a System That Scales
Fewer than 3 in 10 apps retain users past day 30 (Adjust Mobile App Trends Report 2024), which means the vast majority of acquisition spend evaporates inside a month. That is not a creative problem or a targeting problem. It is a systems problem. Mobile app companies in the US are spending more to acquire users than ever before, yet most lack a repeatable, measurable process that connects spend to lifetime value. This post covers exactly what drives cost, which channels deliver the strongest returns in 2026, what the data says about performance benchmarks, and the mistakes that quietly drain budgets. By the end, you will have a clear model for building an acquisition system worth investing in.
Key Takeaways
- Global app install ad spend reached $94 billion in 2023 and continues to climb (Sensor Tower 2024).
- The average cost per install (CPI) across all categories in the US sits between $1.80 and $5.28 on Android and higher on iOS (AppsFlyer Performance Index 2024).
- Apps that run three or more paid channels simultaneously see up to 2x higher retention rates than single-channel campaigns (Adjust Mobile App Trends Report 2024).
- App Store Optimization (ASO) can reduce paid user acquisition costs by 25 to 40 percent when organic visibility improves conversion rate on paid traffic (Mobile Action 2024).
What Is App User Acquisition and Why Do Most Campaigns Underperform?
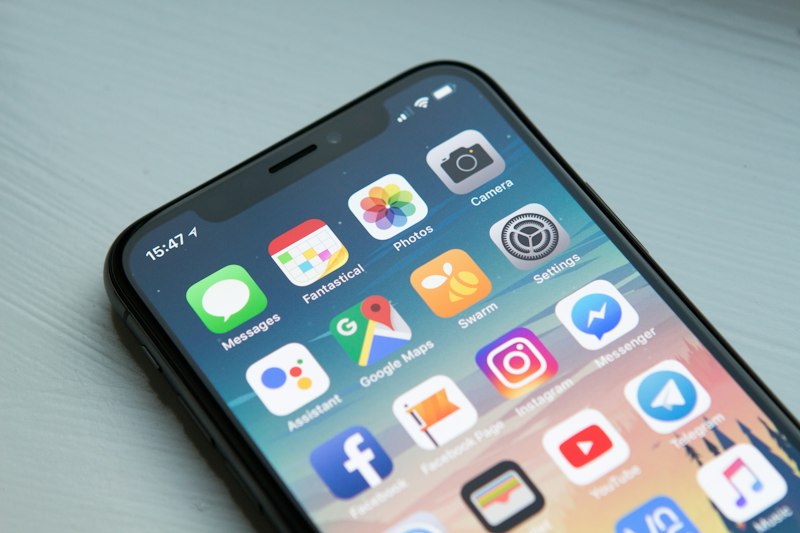
App user acquisition is the process of attracting, converting, and retaining new users for a mobile app through paid and organic channels. Most campaigns underperform not because the channels are wrong but because teams optimize for installs rather than for the users who actually stick around and generate revenue.
The distinction matters enormously. A gaming app can buy 100,000 installs at $1.50 each and see 95,000 of those users disappear before completing the tutorial. A fintech app can pay $12 per install and generate a two-year customer worth $400. The metric that separates winning campaigns from losing ones is cost per acquiring a retained, revenue-generating user, not raw install volume.
AppsFlyer data from 2024 shows that non-organic installs account for 58 percent of all first opens globally, meaning paid acquisition is the dominant growth lever for most apps (AppsFlyer State of App Marketing 2024). But the same report found that app marketers who fail to connect their mobile measurement partner (MMP) data to in-app revenue events are effectively flying blind. They can see installs. They cannot see which campaigns actually build a business.
Consider the example of a mid-size US fitness app that shifted its primary KPI from CPI to cost per day-7 retained user. The team cut three underperforming Meta ad sets, reallocated budget to Apple Search Ads, and saw their 30-day retention rate climb from 18 percent to 31 percent over 60 days, even as total install volume dropped. Revenue per marketing dollar nearly doubled. The insight was not which channel to use. It was which question to ask the data.
The other consistent failure mode is ignoring the store page. Paid traffic lands on an app store listing, and if that listing converts poorly, every dollar spent on media is partially wasted. Conversion rate on the app store product page is the multiplier on every acquisition campaign you run. A 5 percent improvement in store conversion effectively lowers your CPI by 5 percent across every paid channel simultaneously.
Setting up the right measurement infrastructure, defining events beyond the install, and treating the store page as a conversion asset are the three structural moves that separate campaigns that scale from campaigns that plateau.
How Do You Build a Multi-Channel User Acquisition Strategy That Actually Scales?
A scalable user acquisition strategy starts with a clean measurement foundation, then layers channels in order of margin efficiency. The goal is to reach users across multiple touchpoints without duplicating spend or losing attribution clarity.
Step 1: Install a mobile measurement partner (MMP). Adjust, AppsFlyer, and Branch are the three dominant options in the US market. Pick one, connect it to every channel you plan to run, and define your post-install events before you spend a single dollar on paid media. The events to track at minimum: tutorial completion, first core action, day-1 return, and first purchase or subscription start.
Step 2: Start with Apple Search Ads and Google UAC. Both platforms target users with documented intent (search behavior), which typically delivers better day-30 retention than interest-based channels. Apple Search Ads Advanced lets you bid on specific keywords inside the App Store, and Google's Universal App Campaigns distribute across Search, Play Store, YouTube, and Display automatically. These two channels form the base of nearly every scalable US acquisition stack.
Step 3: Add Meta for scale. Meta's advantage is volume and creative testing speed. It is rarely the most efficient channel on a per-retained-user basis, but it reaches audiences that search-intent channels miss. Use broad targeting with strong creative and let Meta's algorithm optimize toward your defined in-app events rather than installs.
Step 4: Layer organic through ASO in parallel. App Store Optimization services improve keyword ranking and conversion rate on both the App Store and Google Play, which lowers blended CPI across your entire acquisition stack. Every dollar you invest in organic visibility compounds over time, unlike paid spend that stops the moment you pause campaigns.
Step 5: Test incrementally and kill underperformers fast. Allocate no more than 10 to 15 percent of total budget to experimental channels in any given quarter. TikTok, connected TV, and influencer partnerships have all shown strong results for specific app categories, but they require category-specific creative strategies that take time to develop.
The sequence matters. Teams that try to run six channels simultaneously without proper measurement end up with attribution chaos and no clear picture of which channels deserve more budget.
App User Acquisition Benchmarks: What the Data Shows in 2026
Benchmark data gives you a negotiating position when evaluating agency performance and a sanity check when setting internal targets. The numbers below are drawn from published 2024 industry reports and reflect US market conditions extrapolated into 2026 based on observed trends.
| App Category | Avg. CPI (iOS, US) | Avg. CPI (Android, US) | Day-30 Retention |
|---|---|---|---|
| Gaming (Casual) | $2.10 | $0.90 | 8-12% |
| Gaming (Mid-core) | $3.80 | $1.60 | 14-20% |
| Finance / Fintech | $14.50 | $7.20 | 28-35% |
| Health and Fitness | $6.40 | $3.10 | 18-25% |
| Shopping / eCommerce | $4.20 | $2.30 | 15-22% |
| Productivity | $5.90 | $2.80 | 22-30% |
Sources: AppsFlyer Performance Index 2024; Adjust Mobile App Trends Report 2024. 2026 figures represent directional estimates based on published 2024 benchmarks and observed category-level CPI inflation of approximately 8-12% per year.
A few things the table makes clear:
- iOS costs more to acquire on every category, but iOS users in the US typically generate 40 to 70 percent higher lifetime value than Android users in the same category (AppsFlyer State of App Marketing 2024).
- Finance apps pay the most per install because the LTV justifies it. A fintech app with a $400 average 24-month customer value can absorb a $14 CPI and still run a profitable acquisition machine.
- Day-30 retention benchmarks vary wildly by category, which is why cross-category comparisons are misleading. A 22 percent day-30 retention rate is excellent for a casual game and mediocre for a productivity tool.
- Shopping apps show the widest variance in performance, largely because purchase frequency differs so much between, say, a grocery delivery app and a luxury fashion app.
ApsteQ Insight: The teams that consistently beat these benchmarks are not spending more. They are measuring more granularly. Connecting post-install event data to channel-level spend is the single change that most quickly surfaces which campaigns are generating real customers versus vanity installs.
What Are the Biggest User Acquisition Mistakes That Mobile App Companies Make?
The most expensive mistakes in app user acquisition are rarely dramatic. They are quiet, structural errors that compound over months and quarters until the unit economics are so broken that no amount of creative testing can fix them.
Mistake 1: Optimizing campaigns for installs instead of valuable actions. This is the most common and most costly error. When you tell Meta or Google to optimize for installs, those platforms will find the cheapest installs available, which are often low-intent, low-retention users. Shifting the optimization event to "day-3 return" or "first purchase" typically increases CPI by 20 to 40 percent initially, then improves sharply as the algorithm finds better users. The short-term pain of higher CPI is offset by dramatically lower cost per paying user.
Mistake 2: Ignoring creative fatigue. Ad creative on Meta and TikTok fatigues in days, not weeks, at meaningful scale. Teams that launch a campaign with two or three creative variations and leave them running for months are paying rising CPMs for declining performance. Top-performing app marketing teams produce new creative every one to two weeks, systematically testing hooks, formats, and value propositions. A real example: a US language learning app that moved from monthly creative refreshes to weekly ones saw a 34 percent drop in blended CPI over one quarter, without changing channels or budgets.
Mistake 3: Treating ASO as a one-time task. App Store and Google Play algorithms update continuously. Keywords that ranked well in Q1 may lose ground by Q3 without active management. Teams that run a keyword audit once at launch and never revisit it are leaving free organic installs on the table. Our app marketing team consistently finds that active ASO management reduces blended acquisition costs by compounding organic traffic against a fixed paid spend baseline.
Mistake 4: No payback period discipline. Many apps, especially subscription apps, operate on a 6 to 18 month payback period. That is fine, provided you know it and plan for it. Teams that do not calculate payback period end up either cutting spend too early (before the LTV matures) or scaling too fast (before cash flow can support the working capital gap). Define your acceptable payback period, build it into your channel-level targets, and revisit it quarterly.
Mistake 5: Platform over-concentration. Any team running 80 percent or more of their budget through a single channel is one platform policy change or algorithm shift away from a crisis. The Meta iOS 14.5 ATT update in 2021 cut reported ROAS for many app marketers by 30 to 50 percent overnight. Diversification is not just a growth strategy; it is risk management.
Where Is App User Acquisition Heading in 2026 and 2027?
Three structural shifts are reshaping how app companies acquire users right now, and each will accelerate through 2027.
AI-driven creative and bidding are becoming table stakes. Google's Demand Gen campaigns and Meta's Advantage+ Shopping Campaigns both use AI to automate creative testing, audience selection, and bid optimization simultaneously. Early adopters running Advantage+ against manual campaign structures are seeing 15 to 30 percent lower cost per acquisition in several app categories (Meta Business Blog 2024). By 2027, manual campaign management at scale will be the exception, not the rule.
First-party data is the new competitive moat. As mobile identifiers continue to erode under privacy regulations and platform policies, apps that have built robust first-party data pipelines (email, phone, behavioral cohorts tied to consented users) will be able to seed lookalike audiences and retargeting pools that competitors cannot replicate. Teams investing in CRM infrastructure now are building a durable acquisition advantage.
Short-form video is the dominant creative format. TikTok, Instagram Reels, and YouTube Shorts now drive a meaningful share of app installs for consumer-facing apps, particularly in the 18 to 34 demographic. Video ads under 15 seconds with a direct app-feature demonstration in the first 3 seconds consistently outperform static and longer-form formats in click-to-install rate (Sensor Tower Creative Intelligence Report 2024).
The apps that will dominate acquisition in 2027 are the ones investing now in AI automation, first-party data infrastructure, and short-form creative production. Each of those areas requires both technical capability and sustained creative output, which is exactly where a dedicated acquisition team earns its cost.
Frequently Asked Questions
What is a realistic cost per install for a US mobile app in 2026?
Cost per install varies sharply by category and platform. On iOS in the US, expect $2 to $5 for casual games, $5 to $10 for health and fitness apps, and $10 to $20 for fintech apps. Android CPIs typically run 40 to 60 percent lower. These figures are based on AppsFlyer Performance Index 2024 benchmarks adjusted for observed annual CPI inflation of approximately 8 to 12 percent.
How many channels should a mobile app run for user acquisition?
Most apps benefit from three to five active channels once they hit product-market fit. Starting with Apple Search Ads and Google UAC covers intent-based acquisition. Adding Meta provides scale. A fourth channel, such as TikTok or DSP programmatic, adds reach diversity. Running fewer than two channels creates dangerous platform concentration risk, as any single algorithm change can devastate performance overnight.
What is the difference between organic and paid app user acquisition?
Paid user acquisition is the process of buying installs or events through ad platforms such as Meta, Apple Search Ads, or Google UAC. Organic user acquisition is driven by App Store Optimization, word of mouth, press coverage, and social sharing. Paid delivers volume and speed. Organic compounds over time at zero marginal cost per install. The strongest acquisition systems use both, with ASO improving the conversion rate that paid traffic lands on.
How do I measure the ROI of my app user acquisition campaigns?
True ROI requires connecting channel-level spend to in-app revenue events through a mobile measurement partner such as Adjust or AppsFlyer. Calculate cost per retained user (installs multiplied by day-30 retention rate divided into spend), then compare that to average 12-month LTV per retained user. A positive ratio of at least 3:1 LTV to CAC is considered healthy for most subscription and freemium app models.
Can a user acquisition agency reduce my blended CPI, and how do I find the right one?
Yes. A specialist agency brings channel expertise, creative testing infrastructure, and benchmark data that most in-house teams build slowly. Look for agencies that report on cost per retained user, not just installs. Ask to see category-specific case studies with before-and-after blended CPI data. Our user acquisition services include full-funnel measurement setup, creative production, and multi-channel campaign management tailored for US app companies.
The Bottom Line on App User Acquisition
Building a user acquisition system that scales comes down to a small number of principles applied consistently:
- Measure post-install events, not just installs, and optimize campaigns toward revenue-generating actions.
- Run three or more channels to avoid platform concentration risk and reach users at multiple intent levels.
- Invest in ASO continuously so organic traffic compounds against your paid spend.
- Define your payback period and build it into every channel-level budget decision.
- Refresh creative weekly, not monthly, especially on Meta and TikTok.
- Prepare your first-party data infrastructure now for the privacy-first acquisition landscape ahead.
If your app is scaling and you need a team that combines measurement setup, multi-channel campaign management, and creative production under one roof, we can help you build it. Book a free strategy call with the ApsteQ team and we will audit your current acquisition stack, identify your biggest margin leaks, and map a channel plan built around your specific LTV and payback targets.
Free download
The App UA Cost Report 2026
Real cost-per-install and cost-per-trial benchmarks by channel and category, so you know what you should be paying.
Get the Free EbookBrowse all free guides