
User Acquisition Cost Formula: The Complete Guide for Mobile App Companies in 2026
The average cost to acquire a single paying mobile app user in the US hit $4.01 for iOS and $1.72 for Android in 2025 (AppsFlyer Performance Index 2025), yet most app teams calculate their user acquisition cost (UAC) incorrectly, mixing blended averages with channel-specific data and drawing the wrong conclusions. If your campaigns are scaling spend without scaling revenue, a broken UAC formula is usually the culprit. This guide walks through the exact formula, how to benchmark your numbers against real industry data, and the four most expensive mistakes teams make when calculating and acting on UAC.
Key Takeaways
- The core UAC formula is Total Campaign Spend ÷ Total New Users Acquired, but that baseline number is nearly useless without segmenting by channel, cohort, and paid versus organic attribution (AppsFlyer Performance Index 2025).
- Gaming apps see a median iOS CPI of $1.80–$3.50, while finance apps average $7.00–$20.00+ per install depending on the engagement event used (Adjust Mobile App Trends Report 2025).
- Apps that optimize toward a downstream conversion event, not the install, reduce effective UAC by 20–35% on average (AppsFlyer Performance Index 2025).
- Only 32% of mobile marketers correctly account for organic uplift when reporting paid UAC, inflating their reported cost and suppressing budget (Sensor Tower State of Mobile 2025).

What Is the User Acquisition Cost Formula and How Do You Calculate It Correctly?
User acquisition cost (UAC) is the total marketing and sales spend required to bring one new user into your app. The standard formula is straightforward: UAC = Total Spend ÷ Total New Users Acquired. Where teams go wrong is in defining both variables sloppily.
"Total spend" should include every dollar attributable to that channel or campaign: media buy, creative production, agency fees, and the proportional cost of any tools used to run or measure the campaign. Leaving out creative production costs, for example, routinely understates true UAC by 15–25% on high-volume campaigns. On the user side, "new users" must be deduped, verified against your attribution provider, and ideally segmented by whether they completed a meaningful first action, not just opened the app once.
Here is the three-tier version most growth teams should use:
- Tier 1, Install-level UAC: Total Spend ÷ Installs. Use this for funnel-top benchmarking only.
- Tier 2, Activation-level UAC: Total Spend ÷ Users Who Completed Onboarding. This is the number that predicts LTV correlation most reliably.
- Tier 3, Revenue-level UAC: Total Spend ÷ Paying Users or Subscribers. Use this for unit economics and fundraising conversations.
A concrete example: a fitness app running Meta Ads spends $50,000 in a month. It records 25,000 installs, 12,000 onboarding completions, and 2,400 first-time subscription starts. That gives an install-level UAC of $2.00, an activation UAC of $4.17, and a revenue UAC of $20.83. All three numbers are correct. They answer different questions, and confusing them is how budget decisions go sideways.
According to the AppsFlyer Performance Index 2025, apps that track at least two downstream events beyond the install see a 28% improvement in ROAS within 90 days compared to install-only optimizers. The math alone justifies the instrumentation cost.
For subscription apps specifically, the revenue-level UAC must always be compared against LTV:CAC ratio. A healthy benchmark for SaaS and subscription apps is 3:1 or higher (Adjust Mobile App Trends Report 2025). Below 2:1, the unit economics are broken regardless of how efficient individual channels look.
How Do You Reduce UAC Without Cutting Spend?
Reducing UAC without cutting spend means improving the denominator (users acquired) faster than the numerator (spend). Three levers move that ratio: creative efficiency, audience precision, and attribution hygiene. Pulling all three simultaneously is what separates teams that scale profitably from those that plateau.
Step 1: Segment UAC by Channel Before Optimizing Anything
Calculate a separate UAC for each paid channel, Apple Search Ads, Google UAC, Meta Advantage+, TikTok, and programmatic, before you touch bids or budgets. Blended UAC hides which channels are dragging down the average. A channel running at $1.50 install-UAC with 0.8% conversion to subscription is worse than a channel at $4.00 install-UAC with 6% conversion.
Step 2: Test Creative Rotation on a Fixed Cadence
Ad fatigue is one of the fastest ways to watch CPIs climb while nothing else changes. Set a hard rule: rotate at least one creative element (hook, format, or CTA) every 10–14 days per active ad set. Teams that implement systematic creative testing report a median CPM reduction of 18% over a 60-day period (Adjust Mobile App Trends Report 2025).
Step 3: Feed Downstream Events Back to Ad Networks
Meta, Google, and Apple Search Ads all have algorithms that optimize toward whatever signal you give them. If you send only install data, you get cheap installs from users who never pay. Connect your MMP (Mobile Measurement Partner) to pass purchase events, subscription starts, or D7 engagement scores back to the network. This is SKAdNetwork optimization on iOS and standard event optimization on Android.
Step 4: Quantify Organic Uplift Separately
Paid campaigns lift organic installs through brand search and word-of-mouth. If you attribute all acquired users only to paid channels, your paid UAC looks artificially high. Measure the organic baseline in periods without paid activity, then subtract that baseline from your paid periods to isolate true paid-driven organic lift.
Teams that want expert hands managing these levers consistently, especially on multi-channel campaigns where attribution gets complex, often find the ROI case for outsourcing straightforward. The user acquisition services at ApsteQ are built specifically for mobile app companies running paid campaigns across Meta, Google, and Apple Search Ads, with MMP integration included.
UAC Benchmarks Across App Verticals: What Does Good Actually Look Like?
Benchmarks matter because UAC is only meaningful in context. A $6.00 CPI for a casual game is catastrophic; a $6.00 CPI for a fintech app is exceptional. The table below compiles real channel and vertical data from Sensor Tower and AppsFlyer to give US-market mobile teams a concrete reference point.
| App Vertical | Median iOS CPI (USD) | Median Android CPI (USD) | Healthy LTV:CAC Target |
|---|---|---|---|
| Casual Gaming | $1.80–$3.50 | $0.80–$1.80 | 2:1–3:1 |
| Health and Fitness | $3.00–$6.50 | $1.50–$3.50 | 3:1–5:1 |
| Finance and Fintech | $7.00–$20.00+ | $4.00–$12.00 | 4:1–8:1 |
| Ecommerce / Shopping | $2.50–$5.00 | $1.20–$3.00 | 3:1–5:1 |
| Productivity / B2B | $6.00–$15.00 | $3.00–$9.00 | 5:1–10:1 |
Sources: Sensor Tower State of Mobile 2025 and AppsFlyer Performance Index 2025.
Several patterns in this data deserve attention:
- The iOS-to-Android CPI gap in fintech is the widest of any vertical, often 2x or more, because iOS users in finance skew toward higher-income demographics with stronger conversion rates downstream.
- Productivity and B2B apps tolerate the highest UAC because LTV (often driven by annual subscriptions or seat-based pricing) is far larger than in consumer verticals.
- Casual gaming has the lowest CPIs but also the tightest LTV margins, which is why gaming companies invest so heavily in ASO and organic to offset paid costs.
The Sensor Tower State of Mobile 2025 report found that US app install ad spend grew 11% year-over-year in 2024, with iOS capturing 62% of that spend despite Android's larger install volume. That spend concentration on iOS pushes CPIs up, which reinforces the case for pairing paid acquisition with strong app store optimization to lower your blended UAC.

What Are the Most Expensive UAC Calculation Mistakes App Teams Make?
The most expensive UAC mistakes are not bad bids or weak creatives. They are measurement errors that cause teams to cut profitable channels and scale unprofitable ones, sometimes for months before the damage shows up in revenue numbers.
Mistake 1: Using Last-Touch Attribution for Multi-Touch Journeys
Last-touch attribution assigns 100% of the credit for an install to the final touchpoint. For users who saw a TikTok ad, searched the brand on Google, then clicked an Apple Search Ads result, last-touch credits only Apple Search Ads. This inflates Apple Search Ads' contribution and makes awareness channels like TikTok look unproductive. The fix is to run a data-driven or linear attribution model in your MMP alongside last-touch, then compare before reallocating budget.
Mistake 2: Reporting UAC Without a Time Window
UAC without a cohort window is a meaningless number. A campaign that looks expensive at Day 7 may be your best performer at Day 90 because of delayed conversions and referral behavior. Always report UAC with a stated measurement window: D7, D30, and D90 UAC are three different numbers. Mixing them in the same report is how "that campaign was expensive" becomes a false conclusion.
Mistake 3: Ignoring Re-engagement Spend in UAC
Re-engagement campaigns target lapsed users, not new ones. Including re-engagement spend in your new-user UAC calculation inflates the cost and can make acquisition campaigns look 20–40% more expensive than they are. Keep new acquisition and re-engagement budgets in separate line items from day one.
Mistake 4: Not Adjusting for Seasonality
CPMs spike sharply in Q4 due to retail ad auction competition. An app team that evaluates its October UAC against its June UAC without adjusting for the seasonal CPM premium may incorrectly conclude their campaigns "got worse" when the underlying conversion rate is identical. According to Adjust Mobile App Trends Report 2025, Q4 CPMs for US app campaigns average 35–55% higher than Q2 CPMs, with gaming and ecommerce verticals seeing the sharpest spikes.
Teams running multi-vertical or multi-market campaigns often reach a point where in-house measurement capacity becomes the bottleneck. The app marketing services at ApsteQ include attribution audits that identify exactly where UAC is being miscalculated before spend scales further.
Where Is UAC Heading in 2026 and 2027?
Two structural shifts are reshaping how mobile app companies calculate and optimize UAC right now, and both will deepen over the next 18 months.
The first is the continued maturation of privacy-preserving measurement. Apple's SKAdNetwork is now on version 4.0, and Google's Privacy Sandbox for Android has moved from beta to general availability. Both frameworks limit the granularity of user-level data that flows back to ad networks. In practice, this means campaign-level UAC numbers are becoming less precise at the user level and more reliable at the cohort level. Teams that have not yet adapted their reporting to cohort-based UAC are operating on increasingly noisy data.
The second shift is AI-driven bidding taking over more of the optimization layer. Meta's Advantage+ and Google's Demand Gen campaigns already automate creative selection, audience targeting, and bid adjustments simultaneously. According to data.ai (formerly App Annie) State of Mobile 2025, apps using fully automated campaign types saw a median 22% reduction in effective CPIs compared to manually managed campaigns in 2024, though this gap narrows significantly when manual campaigns are managed by experienced teams.
Looking toward 2027, the teams with the lowest UAC will almost certainly be those that combine AI-automated bidding with proprietary first-party data signals, post-install behavioral data fed back to networks in real time. The companies building those data feedback loops now are creating a structural cost advantage that will compound. Investing in that infrastructure, either in-house or through a specialist partner, is not optional for apps competing at scale.
Frequently Asked Questions
What is the basic user acquisition cost formula for mobile apps?
The basic formula is UAC = Total Marketing Spend ÷ Total New Users Acquired. For meaningful analysis, segment this into three tiers: install-level UAC, activation-level UAC, and revenue-level UAC. Each answers a different business question. Most teams should optimize toward activation or revenue UAC rather than raw installs, since install-only UAC has nearly zero correlation with profitability.
What is a good UAC for a mobile app in the US market?
"Good" depends entirely on your vertical and LTV. Casual gaming apps target $1.80–$3.50 on iOS, while fintech apps may accept $7–$20+ because their LTV justifies it. The real benchmark is your LTV:CAC ratio, which should sit at 3:1 or higher for most consumer subscription apps. A $2.00 UAC with a $3.00 LTV is far worse than a $15.00 UAC with a $90.00 LTV (AppsFlyer Performance Index 2025).
How does organic uplift affect paid UAC calculations?
Paid campaigns drive brand search and word-of-mouth installs that appear as "organic" in your dashboard. If you assign all credit to paid channels, you overstate true paid UAC. Measure your organic install baseline during periods without paid activity, then subtract that baseline from paid periods. Correctly accounting for organic uplift typically reduces reported paid UAC by 10–20% (Sensor Tower State of Mobile 2025).
Should re-engagement spend be included in UAC calculations?
No. Re-engagement campaigns target existing users who have lapsed, not new users. Including re-engagement spend in your new-user UAC inflates the cost figure by 20–40% on average and creates false signals that can cause you to cut productive acquisition channels. Always separate new acquisition budgets from re-engagement budgets in your reporting structure from the start of any campaign.
How can a professional app marketing agency help lower my UAC?
An agency with deep mobile expertise brings three things most in-house teams lack: cross-client benchmark data, dedicated creative testing infrastructure, and MMP integration experience. At ApsteQ, our user acquisition team runs attribution audits, sets up downstream event optimization, and manages creative rotation systematically. Clients typically see UAC reductions of 20–35% within the first 90 days by fixing measurement gaps alone.
Conclusion
The user acquisition cost formula itself is simple. The hard part is measuring it correctly, segmenting it by channel and cohort, comparing it to the right vertical benchmarks, and feeding accurate signals back to ad networks so their algorithms optimize toward revenue rather than installs. The key points to take forward:
- Use three UAC tiers: install, activation, and revenue level, and never mix them in the same report.
- Benchmark against vertical-specific CPI ranges, not industry-wide averages.
- Fix attribution before scaling spend; measurement errors cause more budget waste than bad creative.
- Account for organic uplift and keep re-engagement spend out of new-user UAC calculations.
- Build first-party data feedback loops now, because privacy changes will make them the primary optimization lever by 2027.
If your team is spending on user acquisition but UAC is not moving in the right direction, the problem is almost always in the measurement layer, not the media. Book a free strategy call with the ApsteQ team and we will audit your attribution setup, benchmark your current UAC against your vertical peers, and map out exactly where the margin is leaking.
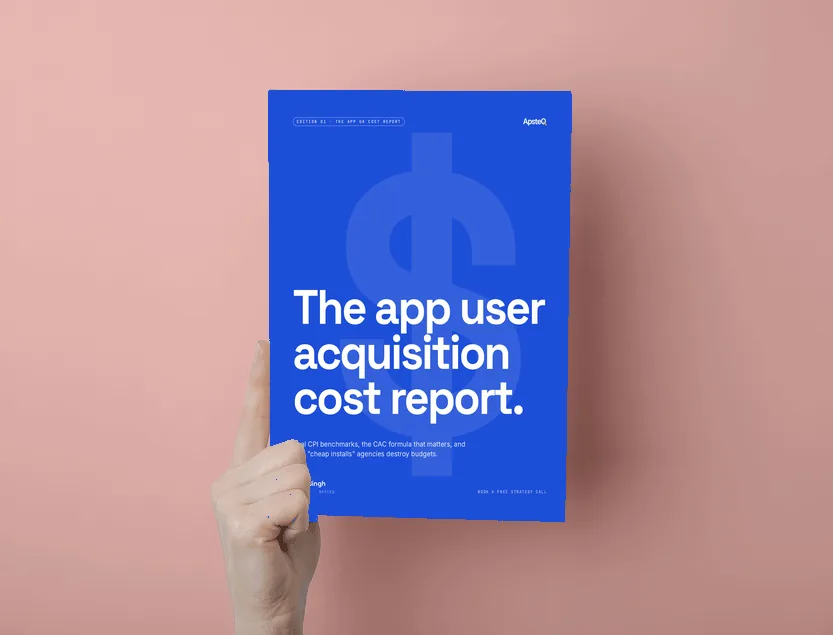
Free download
The App UA Cost Report 2026
Real cost-per-install and cost-per-trial benchmarks by channel and category, so you know what you should be paying.
Get the Free EbookBrowse all free guides