
How Much Is My Growth App Worth? The Complete Valuation Guide for Mobile App Companies
Understanding the value of your growth app is the first step to making smarter investor, acquisition, and scaling decisions. This guide walks mobile app companies through every major valuation method, benchmark, and pitfall so you can arrive at a defensible number fast.
Most mobile app founders dramatically underestimate or overestimate their app's worth, and the gap between those two mistakes costs real money. Apps sold on the open market in the US fetched a median multiple of 3x to 5x annual revenue in recent transaction data, yet many founders anchor to guesswork instead of methodology. According to Sensor Tower's 2024 market analysis, the global app economy generated more than $171 billion in consumer spend, meaning buyers are actively hunting for quality assets. Whether you are raising a Series A, fielding an acquisition offer, or simply benchmarking your progress, knowing how to value a growth app is non-negotiable.
In this guide you will learn the four primary valuation frameworks, the metrics that move multiples up or down, the most common mistakes founders make, and what trends in 2026 and 2027 will reshape how buyers price mobile growth assets.
Key Takeaways
- The global app economy surpassed $171 billion in consumer spend in 2024, creating fierce buyer demand for quality growth apps (Sensor Tower, 2024).
- Growth apps with strong retention metrics, specifically Day-30 retention above 25%, command significantly higher revenue multiples than churn-heavy peers (Adjust, 2024).
- User acquisition costs on iOS in the US averaged $4.00 to $6.50 per install in competitive categories, directly affecting net revenue quality (AppsFlyer, 2024).
- Apps generating recurring subscription revenue are typically valued at 4x to 7x ARR, while ad-supported apps trade closer to 2x to 3x annual net revenue (data.ai, 2024).

What Determines the Value of a Growth App?
App valuation is the process of estimating the fair market worth of a mobile application based on its financial performance, user metrics, and strategic positioning. The single most important insight here is that revenue alone does not set your price, the quality and predictability of that revenue does.
Buyers and investors evaluate growth apps across four primary frameworks. The first is the revenue multiple method, where your app's annual recurring revenue (ARR) or trailing twelve-month (TTM) net revenue is multiplied by a benchmark figure. Subscription apps in the US consistently attract 4x to 7x ARR multiples, while purely ad-supported apps trade at 2x to 3x net revenue (data.ai, 2024). The second framework is a discounted cash flow (DCF) model, which projects future free cash flows and discounts them back to present value. DCF is more common in larger transactions above $5 million in deal size.
The third framework is comparable transactions analysis, matching your app against recently sold apps with similar category, monetization model, and audience size. Sensor Tower's 2024 market pulse showed that health and fitness apps commanded the highest average multiples among consumer categories due to strong subscription adoption and low churn. The fourth framework is asset-based valuation, which tallies your codebase, user database, brand equity, and intellectual property. This method is most relevant when revenue is pre-launch or minimal.
Take a concrete example. Suppose your fitness growth app generates $600,000 in ARR, holds a Day-30 retention rate of 28%, and runs almost entirely on a subscription model with less than 8% annual churn. A buyer using the revenue multiple method would likely apply a 5x multiple, arriving at a $3 million starting valuation. Strong retention and low churn push that multiple toward the top of the range. If your Day-30 retention were only 12% and churn ran at 22%, that same $600,000 ARR might attract only a 3x multiple, cutting your valuation to $1.8 million. The delta is $1.2 million on the same top-line revenue, driven entirely by user quality.
Two metrics deserve special attention. Lifetime value (LTV) is the projected total revenue a single user generates over their relationship with your app. LTV to CAC ratio, the relationship between lifetime value and the cost to acquire a new user, is the single metric buyers interrogate most aggressively. AppsFlyer's 2024 research showed that iOS user acquisition costs in competitive US verticals averaged $4.00 to $6.50 per install, meaning an LTV of at least $15 to $20 is necessary to sustain a healthy ratio and attract premium multiples.
How Do You Calculate Your Growth App's Value Step by Step?
Calculating your growth app's value is a structured process, not a single formula. The most reliable approach combines two or three frameworks, then triangulates a range rather than a single point estimate.
Follow these steps to build a defensible valuation:
- Pull your trailing twelve-month net revenue. Use net revenue after platform fees (Apple takes 15-30%, Google Play similarly). This is your base number for revenue multiple calculations.
- Segment revenue by type. Separate subscription revenue, one-time in-app purchases, and advertising revenue. Apply the appropriate multiple to each bucket. Subscription revenue earns the highest multiple because it is predictable.
- Calculate your LTV and CAC. Divide your average monthly revenue per user by your monthly churn rate to estimate LTV. Divide total marketing spend by new users acquired in the same period to get CAC. A ratio of 3:1 or higher signals a healthy, scalable acquisition engine.
- Benchmark your retention. Pull your Day-1, Day-7, and Day-30 retention curves from your analytics platform. Adjust's 2024 mobile benchmarks established that growth apps with Day-30 retention above 25% are categorized as top performers, and top performers earn premium multiples.
- Document growth rate. Month-over-month and year-over-year revenue growth rate is a multiplier on your multiple. An app growing at 20% year-over-year commands a meaningfully higher price than a flat app with identical current revenue.
- Compile a data room. Buyers expect access to App Store Connect or Google Play Console analytics, MMP (mobile measurement partner) reports from tools like Adjust or AppsFlyer, a P&L, and churn cohort analysis. Missing data reduces trust and compresses multiples.
- Run a comparable transactions search. Use platforms like Acquire.com, Flippa, or direct M&A advisors specializing in mobile to find recent sale prices for apps in your category and revenue range.
The app marketing strategies you have deployed also factor into valuation. An app with diversified, organic-heavy user acquisition is worth more than one dependent on a single paid channel, because buyer risk is lower when growth is not fragile.
ApsteQ Insight: Founders often skip the data room step until they are already in diligence. Building clean, exportable analytics reports every quarter saves weeks of scrambling when a buyer or investor appears unexpectedly.
Growth App Valuation Benchmarks: What the Data Actually Shows
Benchmarks contextualize your metrics against the market and reveal whether your app is positioned to command a premium or a discount multiple. The data paints a clear picture: monetization model, retention, and category are the three biggest levers.
Here is a breakdown of how key variables shift multiples in the US market:
| Monetization Model | Typical Multiple Range | Key Driver |
|---|---|---|
| Subscription (SaaS-style) | 4x to 7x ARR | Predictable, recurring cash flow |
| Freemium with IAP | 3x to 5x TTM Net Revenue | Conversion rate and ARPU |
| Ad-Supported | 2x to 3x TTM Net Revenue | DAU/MAU ratio, CPM rates |
| Hybrid (Sub + IAP + Ads) | 3.5x to 6x ARR | Revenue diversification |
Additional benchmark data points from approved sources reinforce the valuation picture:
- Global consumer app spending grew to $171 billion in 2024, reflecting sustained buyer and investor appetite for mobile assets (Sensor Tower, 2024).
- Apps with a Day-30 retention above 25% are classified as top performers across verticals, a threshold that directly correlates with premium acquisition multiples (Adjust, 2024).
- The average iOS user in the US spends $28 per year on apps and in-app purchases, providing a ceiling benchmark for ARPU models in consumer categories (Statista, 2024).
- AppsFlyer's 2024 research confirmed that apps using at least three diversified paid UA channels reduced their effective CPI by an average of 18% compared to single-channel peers, directly improving LTV:CAC ratios (AppsFlyer, 2024).
Category matters enormously. Health and fitness apps held the highest median multiples among consumer categories in Sensor Tower's 2024 transaction analysis, followed by productivity tools and finance apps. Casual gaming apps, despite high download volumes, typically attracted lower multiples due to notoriously high churn and dependency on advertising revenue cycles.
A worked example illustrates the benchmark logic. An education app with $400,000 in ARR, 30% Day-30 retention, 6% annual churn, and 40% year-over-year growth would likely receive offers in the 5.5x to 6.5x ARR range, implying a valuation of $2.2 million to $2.6 million. Strip out the growth rate (make it flat) and the multiple probably compresses to 4x, cutting the offer to $1.6 million. Growth rate added $600,000 to $1 million in value on the same ARR.

What Mistakes Are Mobile App Companies Making When Valuing Their App?
The most damaging mistakes in growth app valuation are systematic and repeatable. Fixing them before entering any negotiation or fundraise can add hundreds of thousands of dollars to your outcome.
Mistake 1: Valuing on gross revenue instead of net revenue. Platform fees from the Apple App Store and Google Play reduce your take-home revenue by 15% to 30%. A founder quoting $1 million in gross revenue is actually presenting $700,000 to $850,000 in net revenue. Sophisticated buyers immediately rebase to net, so presenting gross revenue as your headline number signals inexperience and invites lowball offers.
Mistake 2: Ignoring churn in the multiple conversation. Two apps with identical ARR but different churn profiles are not worth the same. An app at 5% annual churn retains 95 cents of every revenue dollar into next year. An app at 30% annual churn retains only 70 cents. Buyers model this explicitly. Founders who do not understand their churn cohorts cannot defend their multiple when buyers push back.
Mistake 3: Conflating downloads with value. High download counts are a vanity metric unless paired with activation, retention, and monetization data. An app with 2 million downloads and 1% conversion to paid is worth less than an app with 50,000 downloads and 15% conversion to paid, if the revenue and retention support it. Many founders lead with download numbers in pitch decks, which signals to buyers that the real metrics are weak.
Mistake 4: Underestimating the cost of single-channel dependency. An app that sources 80% of its new users from one Meta Ads campaign carries significant concentration risk. If that campaign degrades or the platform's algorithm shifts, revenue collapses. Buyers discount heavily for this, sometimes by a full multiple turn. Diversified acquisition channels, including organic search, app store optimization (ASO), and referral, command premium valuations.
Mistake 5: Skipping professional app marketing audits before sale. Many founders list their app for sale without first optimizing their App Store listing, improving their ASO score, or cleaning up their paid UA attribution. A few weeks of pre-sale marketing optimization can materially lift trailing revenue and retention metrics, directly improving the multiple a buyer applies.
A real cautionary example: a US-based productivity app generating $250,000 ARR listed on a marketplace at a 6x multiple ($1.5 million ask). Buyers discovered 35% annual churn, 90% user acquisition from a single Google UAC campaign, and no clean analytics export. The final sale price was $480,000, less than a 2x multiple. The founder left over $1 million on the table by skipping pre-sale preparation.
What Will Shape Growth App Valuations in 2026 and 2027?
The forces reshaping growth app valuations over the next 18 to 24 months are already visible in data and deal flow. Mobile app companies that position ahead of these trends will command higher multiples; those that ignore them will see compression.
AI-native features are becoming a baseline expectation, not a differentiator. Buyers in 2026 are increasingly scrutinizing whether an app's core loop incorporates machine learning personalization, AI-driven onboarding, or predictive retention mechanisms. Apps without these features are perceived as legacy products requiring costly rebuilds post-acquisition, which suppresses offers. The apps commanding the highest multiples in current deal flow use AI to lower churn and increase ARPU simultaneously.
Privacy-first attribution is reshaping LTV modeling. Apple's App Tracking Transparency framework and ongoing signal loss from both iOS and Android have fundamentally changed how buyers trust LTV projections. Buyers now demand cohort-level revenue data from MMPs like Adjust or AppsFlyer that does not rely on user-level IDFA data. Apps with robust SKAdNetwork or Privacy Sandbox measurement infrastructure are perceived as lower risk, translating to higher multiples.
Subscription fatigue is creating opportunities for hybrid monetization models. Consumer app subscription spending is plateauing in saturated categories. Apps that blend subscriptions with consumable in-app purchases or premium one-time unlocks are diversifying revenue in ways that reduce churn sensitivity. This hybrid approach is emerging as a multiple-expander in 2026 deal flow.
Statista's 2024 global app market projections forecast continued growth in overall consumer spending through 2027, with the strongest growth in health, AI tools, and emerging market consumer apps. For US-based growth app companies, this means buyer competition for quality assets will intensify, rewarding founders who invest in metrics hygiene and channel diversification now.
Forward-looking synthesis: The apps that will command 6x to 8x multiples in 2027 are being built today with AI personalization, diversified UA channels, and privacy-compliant attribution infrastructure. The window to build these foundations before a transaction is narrowing.
Model your subscription app's lifetime value with the Subscription App LTV Calculator. Enter your subscription price, churn rate, and retention curve to calculate the total revenue your current user cohorts will generate, then explore how improvements to onboarding or retention compound into higher valuations.
Frequently Asked Questions
What is the average valuation multiple for a growth app in the US?
Subscription-based growth apps in the US typically trade at 4x to 7x ARR, while ad-supported apps fetch 2x to 3x trailing net revenue (data.ai, 2024). The specific multiple depends on churn rate, retention quality, growth trajectory, and user acquisition channel diversification. Apps with Day-30 retention above 25% and annual churn below 10% consistently attract the upper end of these ranges.
How does churn rate affect my app's valuation?
Churn rate is one of the three most influential variables in app valuation. Each 5-percentage-point increase in annual churn can compress your revenue multiple by 0.5x to 1x. An app with 35% annual churn may receive a 2x offer on ARR, while an identical app with 8% annual churn could attract 5x or more. Buyers model next-year retained revenue explicitly during diligence.
Do downloads count toward my growth app's valuation?
Downloads alone carry almost no weight in a professional valuation. Buyers and investors convert downloads into activated users, then into paying users, then model LTV and churn from those cohorts. An app with 5 million downloads and 0.5% paid conversion is worth far less than an app with 200,000 downloads and 12% paid conversion, assuming comparable net revenue and retention quality.
How can I increase my growth app's valuation before selling?
The highest-ROI pre-sale actions are reducing churn through improved onboarding, diversifying user acquisition across at least three channels, migrating ad-only revenue toward a subscription or hybrid model, and building a clean analytics data room. Explore the app marketing services at ApsteQ to strengthen your UA channel mix before entering any sale or fundraising process. Even 90 days of optimization can meaningfully lift your multiple.
What role does app category play in valuation?
Category shapes valuation through its effect on expected churn, ARPU benchmarks, and buyer demand. Health and fitness and productivity apps have attracted the highest median multiples in recent US transaction data (Sensor Tower, 2024), primarily due to strong subscription adoption. Casual gaming apps generally attract lower multiples because of higher churn, advertising revenue dependency, and sensitivity to platform algorithm changes.
Conclusion
Valuing a growth app is not guesswork. It is a disciplined process anchored to revenue quality, retention benchmarks, monetization model, and growth trajectory. Here are the core takeaways:
- Subscription apps trade at 4x to 7x ARR; ad-supported apps trade at 2x to 3x net revenue (data.ai, 2024).
- Day-30 retention above 25% and annual churn below 10% are the thresholds that separate premium multiples from average ones (Adjust, 2024).
- Downloads are vanity. LTV:CAC ratio, churn cohorts, and growth rate are what buyers actually price.
- Pre-sale optimization of UA channels, ASO, and analytics infrastructure can add meaningful value before any transaction.
- AI-native features and privacy-compliant attribution will define premium valuations through 2027.
If you want a clear-eyed, data-driven assessment of your growth app's current value and a roadmap to increase it, the next step is a conversation with a specialist. Book a free strategy call with ApsteQ and get a customized valuation framework built around your app's specific metrics, category, and growth goals.
Free download
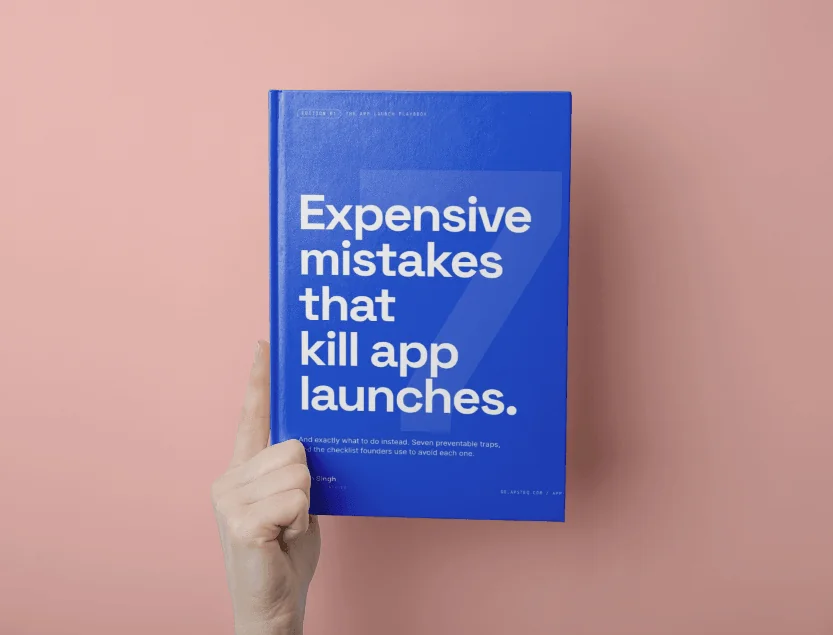
7 Expensive Mistakes That Kill App Launches
The launch errors we see most often across 300+ app engagements, and what to do instead.
Get the Free Ebook Browse all free guides