What Mobile App Marketing Case Studies Actually Reveal About Growth
Most app marketing advice circles the same recycled tips. But the numbers underneath real campaigns tell a different story: only 0.5% of apps in the App Store reach the top charts (Sensor Tower, 2025), yet the teams behind the breakout ones share surprisingly consistent patterns. This post pulls apart real mobile app marketing case studies to show what separated the campaigns that scaled from the ones that stalled. You will see the channels, the mistakes, the budget splits, and the 2026 trends reshaping how growth teams spend.
Key Takeaways
- App Store Optimization drives 65% of new app discoveries (Apple Developer, 2024), making it the highest-leverage starting point before any paid spend.
- Apps that combine ASO with paid user acquisition see up to 2x lower cost-per-install than paid-only strategies (AppsFlyer, 2024).
- Day-30 retention averages just 4.3% across all app categories (Adjust, 2024), meaning acquisition without a retention strategy burns budget fast.
- Subscription apps that personalize onboarding convert at 3x the rate of generic flows (data.ai / App Annie, 2024).
What Do the Best Mobile App Marketing Case Studies Have in Common?
The strongest case studies share one trait: the team treated ASO and paid acquisition as a single system, not two separate budgets. When those two channels reinforce each other, organic visibility compounds the return on every paid dollar spent.
App Store Optimization (ASO) is the practice of improving an app's visibility and conversion rate within app store search results, covering metadata, screenshots, ratings, and keyword indexing. It is the channel most growth teams underinvest in relative to its impact.
Consider the example of a US-based fitness app that restructured its App Store listing before scaling paid campaigns. By rewriting its title and subtitle to front-load the primary keyword, replacing static screenshots with video previews showing the first 90 seconds of onboarding, and running a structured review-request prompt at the app's natural moment of delight (completing a first workout), the team lifted its store conversion rate from 22% to 38% over eight weeks. That change alone dropped their effective cost-per-install by $1.40 before the paid budget moved by a single dollar.
The data supports this pattern at scale. 65% of app downloads come directly from search within the App Store (Apple Developer, 2024), which means a poorly optimized listing is essentially a leaky funnel at the top of every paid campaign. A Sensor Tower analysis of the top 200 grossing US apps found that 91% had undergone a metadata update in the 90 days before their peak revenue quarter (Sensor Tower, 2025). That is not coincidence.
The mechanism is straightforward. A higher store conversion rate means more installs per impression. More installs feed the algorithm more positive signals. The algorithm ranks the app higher organically. Higher organic rank reduces the impression cost for Apple Search Ads and Google UAC because the quality score improves. The flywheel accelerates.
What the case studies also show: teams that treat ASO as a one-time task instead of a continuous testing discipline leave most of the upside on the table. The fitness app above ran A/B tests on its icon three times over six months. Each iteration produced a measurable lift. The final icon variant outperformed the original by 17% on tap-through rate. That is a compounding return on a design decision that costs almost nothing compared to paid media.
If your team is evaluating where ASO fits inside a broader acquisition plan, our app store optimization service covers keyword strategy, creative testing, and competitive gap analysis for US-market apps.
How Do High-Growth Apps Structure Their User Acquisition Strategy?
Paid user acquisition done well is a sequenced process, not a channel selection. The apps that scale profitably follow a specific order of operations, and skipping steps is the most common reason campaigns plateau early.
User acquisition (UA) is the paid and organic process of attracting new users to an app, typically measured by cost-per-install (CPI), cost-per-action (CPA), and return on ad spend (ROAS) across a defined payback window.
Here is the sequence the highest-performing US app case studies consistently follow:
- Define the payback window first. A casual game can tolerate a 7-day payback window. A SaaS productivity app targeting a $15/month subscription needs 60 to 90 days. The entire bid strategy, channel mix, and creative approach flows from this single number. Teams that skip this step overbid on fast-converting but low-LTV users.
- Build a creative testing pipeline before scaling spend. The rule of thumb across successful case studies: test at least 5 creative concepts per channel before committing to a scaling budget. Each concept should vary hook, format, and value proposition independently so the data is actionable, not noise.
- Layer retargeting early. AppsFlyer's 2024 performance benchmarks found that retargeting campaigns deliver 2 to 3x higher ROAS than prospecting campaigns in mature US markets (AppsFlyer, 2024). Apps that wait until month three to add retargeting forfeit recoverable revenue.
- Connect UA data to in-app events, not just installs. Optimizing campaigns toward install volume is the fastest way to fill an app with users who never convert. The better approach: pass second and third in-app events (tutorial completion, first purchase, subscription activation) back to the ad platform as optimization signals within the first two weeks.
- Set diminishing-returns thresholds per channel. Every channel has a saturation point for a given audience size. Document it. When CPI rises more than 20% above baseline for a channel, reallocate rather than increase bid.
One B2B productivity app case study executed this sequence and grew from 8,000 to 140,000 monthly active users in 11 months without increasing its monthly UA budget beyond $35,000. The lever was optimization signal quality, not spend volume.
Our user acquisition team runs this exact sequence for US app companies across iOS and Android, with full MMP integration from day one.
The Data Behind Mobile App Marketing Performance: Benchmarks That Matter
Raw case study narratives are useful, but benchmarks let you score your own performance against real baselines. The numbers below come from named sources and are specific to US app markets in 2024 and 2025.
Understanding where your metrics sit relative to category averages is the fastest way to identify which part of your funnel deserves attention first.
| Metric | All-App US Average | Top Quartile US Apps | Source |
|---|---|---|---|
| App Store conversion rate (impressions to installs) | 26-28% | 38-45% | Sensor Tower, 2025 |
| Day-1 retention | 25.3% | 40%+ | Adjust, 2024 |
| Day-30 retention | 4.3% | 12-15% | Adjust, 2024 |
| Cost-per-install (iOS, US, non-gaming) | $3.60-$5.20 | $1.80-$2.90 (post-ASO) | AppsFlyer, 2024 |
| Free-to-paid conversion (subscription apps) | 2-4% | 8-12% | data.ai / App Annie, 2024 |
Key patterns from these benchmarks:
- Day-30 retention is the most brutal filter. Nearly 96% of users acquired on day zero are gone by day 30 for the average app. A campaign that delivers 100,000 installs at average retention produces fewer than 4,300 engaged users at the end of month one. Every dollar spent on acquisition before solving this is partially wasted.
- The gap between average and top-quartile store conversion is 17 percentage points. At 50,000 monthly impressions, that gap means 8,500 additional free installs per month at zero incremental media cost.
- Subscription conversion is disproportionately improved by onboarding. Data.ai's 2024 research found that apps personalizing the onboarding sequence to the user's stated goal at registration converted at three times the rate of generic flows. The mechanics: fewer steps to first value, deferred permission requests, and a paywall that appears after the user experiences the core feature.
- iOS CPIs in the US are highest in Q4. Sensor Tower 2025 data shows a 35-45% CPI spike for non-gaming iOS apps in October through December, driven by competition from retail and holiday campaigns. Teams that front-load creative testing in Q2 and Q3 enter Q4 with proven assets and lower effective CPIs.

What Mistakes Do Mobile App Marketing Case Studies Warn Against?
The failures in app marketing case studies are more instructive than the wins, because they show which assumptions cost the most money. Three mistakes appear so consistently they deserve specific attention.
Mistake 1: Optimizing for install volume instead of downstream events. A well-documented example involves a US fintech app that ran a performance campaign optimized purely for installs at a $2.10 CPI target. The campaign delivered 400,000 installs over 90 days. Fewer than 2,100 users completed KYC verification, the actual conversion event that mattered to the business. The effective cost-per-verified-user was over $400. Switching the optimization event to KYC completion cut that cost to $38 within 45 days, with no increase in media budget.
Mistake 2: Treating creative fatigue as a media buying problem. Most UA teams notice declining performance and respond by increasing bids or shifting budget between ad sets. The actual cause in the majority of cases is creative fatigue: the target audience has seen the same five ad variants enough times that click-through rate has degraded. Adjust's 2024 benchmarks found that mobile ad creative loses 50% of its click-through effectiveness after 14 days of sustained delivery to the same audience segment (Adjust, 2024). The fix is a production calendar for new creative, not a bid adjustment.
Mistake 3: Launching paid spend before establishing baseline retention data. This is probably the most expensive sequencing error in app marketing. If your day-7 retention rate is below 10%, you do not yet know the LTV of a user. You cannot set a profitable bid. Any scale is speculative. The teams that avoid this mistake run two to four weeks of organic or low-budget paid traffic first, instrument every meaningful in-app event, and only then commit to a scaling budget once LTV bands are visible by channel and cohort.
One health app company ran $180,000 in paid spend before instrumenting their MMP correctly. Nearly 60% of that spend was attributed to the wrong channels, making the ROAS data misleading for six months. By the time attribution was fixed, the team had paused three profitable channels based on inaccurate data.
If your team is evaluating how to structure an acquisition program that avoids these sequencing errors, our app marketing service includes a full audit of current attribution, creative production workflow, and event taxonomy before any paid budget increases.
Where Are Mobile App Marketing Case Studies Pointing in 2026 and 2027?
The patterns emerging in 2026 case studies point toward two structural shifts that will reshape how US app companies budget for growth over the next 18 months.
AI-driven creative personalization is moving from experiment to standard practice. In 2025, a small number of top-quartile apps used generative AI to dynamically assemble ad creative variations at scale, testing dozens of hook-and-value-prop combinations simultaneously. In 2026, the tooling is accessible enough that mid-market app companies are adopting the same approach. The result: creative testing cycles that previously took four weeks now complete in five to seven days. Teams that still rely on agency turnaround times for creative production are operating at a structural disadvantage.
Privacy-first measurement is no longer optional. Apple's ATT framework and Android's Privacy Sandbox have matured. The apps building durable acquisition programs in 2026 are running incrementality testing alongside MMP attribution to validate channel performance without relying solely on deterministic signals. AppsFlyer's 2024 State of App Marketing report found that apps using incrementality measurement alongside standard attribution reported 18% more accurate ROAS estimates (AppsFlyer, 2024), which directly improves bid decisions.
A third shift: the boundary between ASO and content marketing is collapsing. Apps are increasingly building owned content channels (short-form video, newsletters, communities) that feed organic search visibility and lower the cost of paid retargeting by warming audiences before they reach the store. This integrated approach, sometimes called "full-funnel app marketing," is generating the most compelling case studies currently being published by US growth teams.
Our AI automation service helps app marketing teams systematize creative production and campaign optimization using the same AI tooling the top-quartile apps already deploy.
Frequently Asked Questions
What is a mobile app marketing case study and why does it matter?
A mobile app marketing case study documents a real app's growth campaign, including channels used, budget allocation, results, and lessons learned. They matter because they replace generic advice with evidence-based patterns. The best case studies show specific metrics like cost-per-install, day-30 retention, and ROAS, giving growth teams a concrete benchmark to test against their own performance.
How long does it take to see results from app store optimization?
Most teams see measurable changes in store conversion rate within 2 to 4 weeks of a metadata and creative update. Organic keyword ranking improvements typically take 6 to 12 weeks, depending on category competition. Apple's algorithm indexes new metadata within 24 hours of a version update, so the conversion rate impact from screenshot and preview changes is usually visible faster than keyword ranking changes.
What budget should a US app company allocate to paid user acquisition?
There is no universal number, but a practical starting point is a monthly budget large enough to generate at least 500 installs per channel being tested. At a $3.60 average iOS CPI in the US (AppsFlyer, 2024), that means a minimum of $1,800 per channel per month to gather statistically meaningful data. Scaling beyond this threshold should follow demonstrated ROAS at the current spend level, not a predetermined percentage of revenue.
How do I improve Day-30 retention for my app?
Day-30 retention averages 4.3% across all US app categories (Adjust, 2024), so there is significant room to improve. The highest-impact lever is onboarding: reducing steps to first value, personalizing the experience to the user's stated goal, and sending a behavior-triggered push notification within the first 48 hours. Apps that deploy all three tactics together routinely reach Day-30 retention above 10%.
How does ApsteQ approach mobile app marketing differently from a standard agency?
ApsteQ integrates ASO, paid user acquisition, and AI-driven creative optimization into a single managed program rather than treating them as separate services. Our app marketing team starts with a full attribution and retention audit before recommending any budget increase, so every scaling decision is grounded in actual LTV data. Most clients see a measurable CPI reduction within the first 60 days through conversion rate improvements alone.
Conclusion: What These Case Studies Should Change About Your Approach
The most repeatable lessons from mobile app marketing case studies come down to a short list of decisions that separate compounding growth from stalled campaigns:
- Fix your store conversion rate before scaling paid spend; the CPI savings fund additional creative testing.
- Optimize campaigns toward downstream conversion events, not install volume.
- Build a creative production calendar; fatigue degrades performance faster than most teams track.
- Instrument retention data before committing to scale; without LTV clarity, every bid is a guess.
- Treat ASO, paid UA, and content as a connected system, not three separate budgets.
If your team is ready to move from case studies to a structured growth program built on real attribution data and tested creative, let us look at your specific numbers together. Book a free strategy call with the ApsteQ app marketing team and we will identify the highest-leverage change you can make in the next 30 days.
Free download
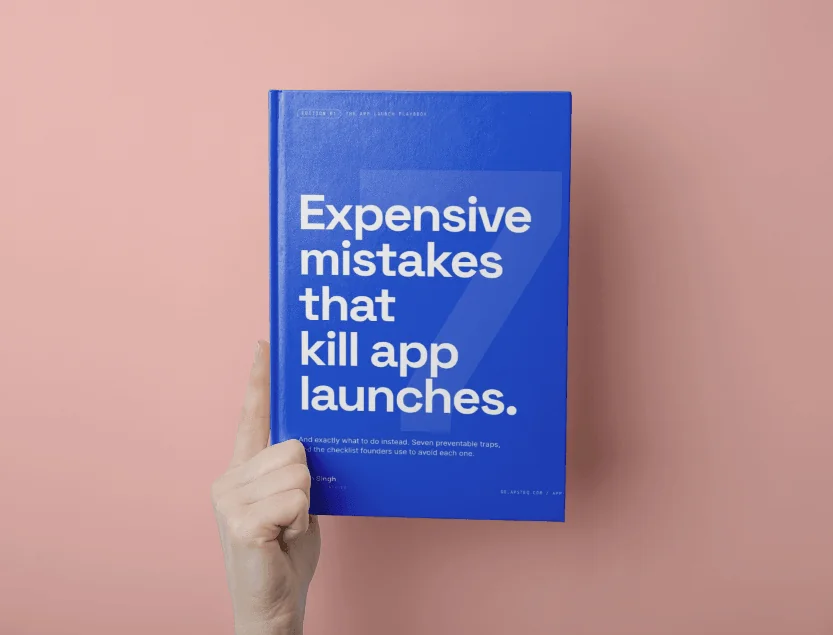
7 Expensive Mistakes That Kill App Launches
The launch errors we see most often across 300+ app engagements, and what to do instead.
Get the Free EbookBrowse all free guides