What Is User Acquisition and Why Does It Determine App Survival?
Most mobile apps lose more than 70% of their users within the first three days after install (Adjust Mobile App Trends Report 2023). That number resets every single growth campaign. If your user acquisition strategy is pulling the wrong people in, retention never had a chance.
This post answers a deceptively simple question: what does user acquisition actually mean for a mobile app company in 2026, and how do you build a system around it that produces paying customers rather than vanishing installs? You will get a clear definition, a breakdown of the main channels, the data that separates efficient programs from expensive ones, the mistakes that quietly kill CAC efficiency, and the trends shaping acquisition spending through 2027.
Key Takeaways
- Global app install ad spend reached approximately $94 billion in 2023 and continues to grow (Statista 2024), making channel selection more consequential than budget size.
- The average cost per install across all app categories on iOS sits near $2.37 while Android averages closer to $1.72 (AppsFlyer Performance Index 2023), but these figures swing dramatically by vertical.
- Apps that personalize their onboarding flow retain roughly 50% more users at day 30 compared to apps with a generic first session (Adjust Mobile App Trends Report 2023).
- Paid user acquisition accounts for the majority of top-chart app installs, yet organic ASO can lower blended CAC by 20-40% when run alongside paid campaigns (Sensor Tower 2024).
What Does User Acquisition Mean in the Context of Mobile Apps?
User acquisition is the full process of attracting new users to a mobile app, from first ad exposure through install, account creation, and the first meaningful action inside the product. It is not simply buying installs. The distinction matters enormously because an install with no downstream action is a sunk cost, not a growth signal.
Think of user acquisition as a pipeline with three connected stages. The first is discovery, where a potential user encounters the app through a paid ad, an organic search result, a friend's referral, or editorial placement. The second is conversion, where that person decides to download. The third is activation, where the user completes a core action that signals genuine intent, such as creating a profile, completing a purchase, or finishing onboarding.
Many teams treat only stage two as "acquisition," optimizing hard for install volume. That framing is costly. Only 25% of users who install an app ever open it more than once (AppsFlyer State of App Marketing 2023). Acquisition programs that ignore activation rates will consistently over-report progress and under-deliver revenue.
A concrete example: a fintech startup running a video ad campaign on Meta optimizes for lowest cost per install and hits a $1.20 CPI. The app store listing looks polished. But the onboarding requires a Social Security number on screen three of seven. Activation drops to 8%. The effective cost per activated user is $15, not $1.20. The acquisition "strategy" looked efficient right up until the unit economics collapsed.
This is why sophisticated mobile teams define acquisition in terms of downstream events. They measure cost per install (CPI), then cost per registration (CPR), then cost per first purchase or first session completion (CPA), and finally lifetime value to customer acquisition cost ratio (LTV:CAC). The ratio most growth teams target is at minimum 3:1 for a sustainable app business (AppsFlyer Performance Index 2023).
User acquisition teams also split their work by traffic source type. Paid acquisition channels include programmatic in-app advertising, social media ads, search ads (Apple Search Ads, Google UAC), and influencer partnerships. Owned channels include app store optimization, content marketing, and email-driven referrals. The blend of these determines blended CAC, and blended CAC is the number that investors actually scrutinize.
How Do You Build a User Acquisition Strategy That Actually Scales?
A scalable user acquisition strategy is built in layers, starting with the most capital-efficient channels and expanding outward only when unit economics are confirmed. Jumping straight to broad paid spend without validating LTV first is the single fastest way to burn a runway.
Here is a practical build sequence for mobile app companies:
- Define your activation event first. Before spending a dollar on paid traffic, agree internally on what "acquired user" means. Is it an account created? A first transaction? A completed tutorial? Every downstream metric depends on this definition.
- Audit your app store listing. App store optimization (ASO) is the cheapest user acquisition lever available. An optimized title, keyword set, and screenshot sequence improves organic conversion rate from store page visit to install. Sensor Tower data shows that top-ranked apps convert store page visits at 30-35% versus 10-15% for poorly optimized listings (Sensor Tower 2024). If you are spending on paid traffic that lands on a weak store listing, you are paying twice for the same leaks.
- Run small paid experiments across two or three channels simultaneously. Test Apple Search Ads and one social channel (typically Meta or TikTok depending on your demographic) with identical creative and landing experiences. Run each for a minimum of two weeks before drawing conclusions. Statistical noise in smaller datasets causes many teams to kill a winning channel prematurely.
- Track cohorted LTV, not aggregate revenue. Users acquired via paid channels in different months behave differently. A January cohort and a June cohort may have identical 7-day retention but completely different 90-day revenue curves. Cohorting reveals which channels produce your best long-term users, not just your cheapest installs.
- Layer in referral and organic once paid CAC is validated. Referral programs typically reduce CAC by 15-25% when the incentive is tied to the app's core value (AppsFlyer State of App Marketing 2023). They also produce users with higher organic intent and, usually, better retention.
If this sequence sounds resource-intensive for an in-house team, it is. Most growth-stage app companies get further faster by working with a specialist. Our app marketing services cover strategy, paid channel management, and ASO in one integrated program, which cuts the feedback loop significantly compared to managing three separate vendors.
User Acquisition Benchmarks: What the Data Shows in 2026
Benchmark data is the fastest way to know whether your CAC is competitive or quietly destroying margin. Averages across all categories are less useful than vertical-specific figures, but they set a baseline for the conversation.
| App Category | Average iOS CPI (USD) | Average Android CPI (USD) | Day-30 Retention Benchmark | Source |
|---|---|---|---|---|
| Gaming (Casual) | $1.50 | $0.90 | 5-8% | AppsFlyer 2023 |
| Gaming (Midcore) | $2.80 | $1.60 | 12-15% | AppsFlyer 2023 |
| Finance / Fintech | $4.10 | $2.50 | 20-25% | AppsFlyer 2023 |
| Health & Fitness | $3.20 | $1.90 | 18-22% | Sensor Tower 2024 |
| E-commerce / Shopping | $2.90 | $1.70 | 10-14% | Sensor Tower 2024 |
| Social / Communication | $2.10 | $1.20 | 15-20% | AppsFlyer 2023 |
A few things jump out of this data. First, finance apps are the most expensive to acquire users for, but also show the strongest retention, which supports a higher acceptable CAC. Second, casual gaming has the cheapest CPIs and the worst retention, meaning monetization has to happen very early in the session or the economics do not close. Third, health and fitness apps land in a middle zone that rewards strong onboarding personalization heavily.
Key benchmarks worth tracking against:
- LTV:CAC ratio of 3:1 or higher is the threshold most mobile-focused VCs use when evaluating growth efficiency (AppsFlyer Performance Index 2023).
- Day-1 retention above 40% is considered healthy across most non-gaming verticals (Adjust Mobile App Trends Report 2023).
- Apps using creative personalization in paid ads see a 20-30% improvement in conversion rate from ad click to install compared to static generic creatives (AppsFlyer 2023).
- Apple Search Ads delivers some of the highest intent traffic available on mobile, with conversion rates from impression to install averaging 50% higher than broad-audience social placements for utility and productivity apps (Apple Developer documentation, 2024).

What Mistakes Kill User Acquisition Efficiency for App Companies?
The most destructive user acquisition mistakes are not the obvious ones. Teams rarely fail because they chose the wrong ad network. They fail because of structural errors in how they measure, target, and onboard.
Mistake 1: Optimizing for installs when you should optimize for events. Mobile measurement partners like Adjust and AppsFlyer allow campaign optimization toward post-install events. Teams that pass an "account created" or "first purchase" signal back to their ad networks see dramatically better user quality over time because the algorithm learns to find more people who complete that action. Teams that only pass "install" are effectively paying for clicks to a landing page and hoping for the best.
Mistake 2: Ignoring creative fatigue. Paid social campaigns for apps typically see performance decline after 5-10 days at scale as the target audience saturates (AppsFlyer 2023). Many teams run the same three creatives for a month, watching CPIs climb and assuming the channel "doesn't work anymore." The channel works; the creative library is exhausted. A healthy paid acquisition program rotates at minimum 8-12 active creatives per campaign, tests new concepts weekly, and kills underperformers at a 72-hour cadence.
Mistake 3: Treating all markets as identical. A US CPI benchmark means nothing if 40% of your installs are coming from Tier 3 markets with negligible monetization. Blended CAC hides geographic misallocation. Segment by country, compare LTV by cohort origin, and reallocate budget toward the markets where your 90-day LTV actually justifies the cost.
Mistake 4: Skipping ASO while scaling paid. This is especially common at growth-stage companies flush with funding. Every paid ad that lands on a weak app store page is losing conversion it should be winning. A Sensor Tower 2024 study found that improving a store listing's first screenshot increased conversion rate by an average of 12% across 500 tested apps. That 12% reduction in effective CPI compounds across every paid channel simultaneously. It is almost always the highest-ROI fix available.
Mistake 5: Building no owned acquisition loop. Pure paid acquisition creates a treadmill. The moment spend stops, growth stops. The most durable app businesses layer in an owned loop, typically content, community, referral, or all three, so that a portion of installs arrive at zero marginal cost. Our user acquisition management services are built around this paid-plus-owned architecture specifically because it produces sustainable unit economics rather than spend-dependent growth.
User Acquisition Trends Shaping Strategy Through 2027
User acquisition is changing faster right now than at any point since the 2021 ATT (App Tracking Transparency) disruption. Three shifts define the 2026-2027 environment.
Privacy-first measurement is the new baseline. SKAdNetwork attribution on iOS and Google's Privacy Sandbox on Android have permanently reduced deterministic signal. Teams that have not invested in probabilistic modeling, media mix modeling (MMM), and incrementality testing are operating on incomplete data. Adjust's 2024 research showed that advertisers using MMM alongside SKAN attribution recovered an average of 35% of the attributed conversions they lost post-ATT (Adjust Blog 2024). This is not optional infrastructure anymore.
AI-generated creative is compressing testing cycles. What took a creative team two weeks to produce (concept, script, shoot, edit, test) now takes two to three days with AI-assisted video tools. The implication is that creative volume is no longer the bottleneck. Strategic judgment about which concepts to test is. Teams that use AI to accelerate production but retain human oversight on message-market fit will outperform teams using AI purely to cut headcount.
Retail media and connected TV are opening new install channels. Amazon's mobile advertising inventory, Roku's performance ad units, and connected TV networks with direct-to-app call-to-action formats are all scaling in 2026. Early data from Sensor Tower suggests that CTV-driven app installs carry a 15-25% higher 30-day retention rate than comparable social-driven installs, likely because of higher intent at the point of exposure (Sensor Tower 2024). For apps in the shopping, finance, and health verticals especially, CTV deserves budget experimentation now rather than in 2027.
Frequently Asked Questions
What is the difference between user acquisition and app marketing?
User acquisition is one component of app marketing, focused specifically on converting non-users into active users through paid, organic, and owned channels. App marketing is broader and includes brand awareness, retention campaigns, lifecycle messaging, and monetization strategy. Most mature mobile companies run both disciplines in parallel, with user acquisition generating new cohorts and retention marketing maximizing their LTV.
What is a good cost per install benchmark for US iOS apps in 2026?
Average US iOS CPI ranges from $1.50 for casual gaming to over $4 for fintech and financial services apps (AppsFlyer 2023). However, CPI alone is not a reliable health metric. A $4 CPI with strong activation and a 90-day LTV of $25 is far more efficient than a $1.50 CPI where fewer than 10% of users complete onboarding.
How does app store optimization affect user acquisition?
App store optimization (ASO) is the practice of improving an app's store listing to increase organic visibility and conversion rate. It directly lowers blended CAC by delivering installs at near-zero marginal cost. Sensor Tower data from 2024 shows that strong ASO can reduce blended CAC by 20-40% when paired with active paid campaigns, because paid traffic converts better on an optimized listing too.
What metrics should a mobile app track for user acquisition performance?
Track CPI (cost per install), CPR (cost per registration), CPA (cost per key in-app action), Day-1 and Day-30 retention, LTV by acquisition cohort and channel, and LTV:CAC ratio. The 3:1 LTV:CAC benchmark is the standard threshold used by growth investors (AppsFlyer 2023). Segment every metric by country and channel to avoid blended averages hiding poor-performing segments.
Should I hire an agency or build an in-house user acquisition team?
Early-stage apps (pre-product-market fit) typically benefit more from an agency because the strategy iteration speed outweighs the cost. Growth-stage apps with validated unit economics often build hybrid models, in-house strategy and analytics paired with agency execution on paid channels. If your team lacks mobile measurement expertise or creative testing infrastructure, working with specialists in user acquisition management is usually faster and cheaper than hiring to fill those gaps internally.
What to Do Next
User acquisition is not a campaign. It is a system connecting paid channels, owned channels, app store optimization, measurement infrastructure, and onboarding into one compounding growth loop. The apps winning in 2026 are not outspending their competitors; they are out-measuring them and out-iterating on creative and targeting.
Here is what this post showed:
- Define acquisition by activation events, not install counts
- Benchmark your CPI and retention against vertical-specific data, not overall averages
- Run paid and ASO together; each amplifies the other
- Avoid the five structural mistakes that silently raise CAC without visible warning signs
- Build for privacy-first measurement and CTV now, before competitors catch up
If your app's growth program needs an outside audit or a full rebuild, we can help. Book a free strategy call with the ApsteQ team and we will diagnose your current acquisition funnel, identify the highest-leverage fixes, and show you what a properly structured program looks like for your specific vertical and market.
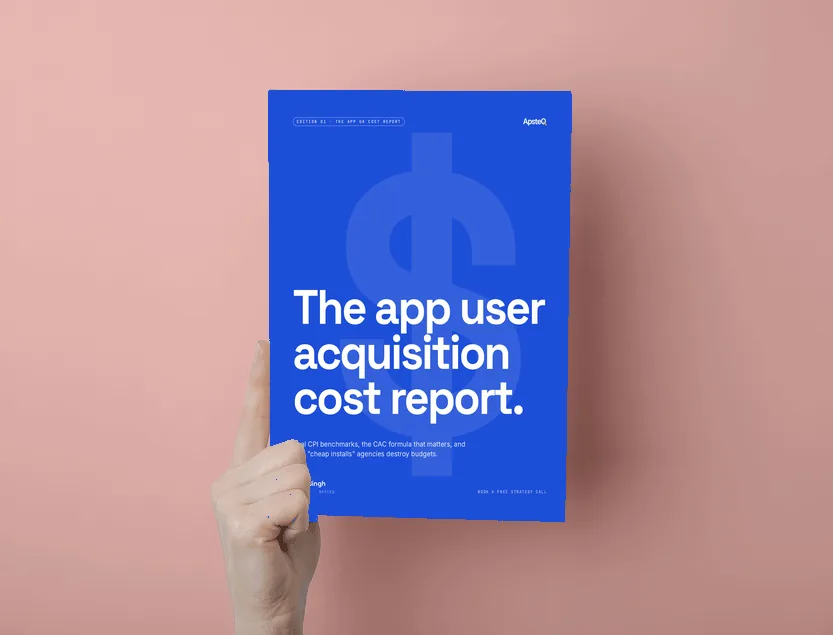
Free download
The App UA Cost Report 2026
Real cost-per-install and cost-per-trial benchmarks by channel and category, so you know what you should be paying.
Get the Free EbookBrowse all free guides