Mobile app advertising is the practice of buying installs and in-app actions across Apple Ads, Google App Campaigns, Meta, and TikTok. In 2026 the median Apple Ads cost per tap is $0.92, but the range runs from $0.24 to $14.41 depending on your category. That spread, not the average, is what should shape your budget.
This is a practical guide to what each network is good for, what it costs, and how to tell whether your spend is working. Every benchmark is cited; the operating notes come from managing these accounts directly.
What Counts as Mobile App Advertising?
Four networks account for the overwhelming majority of app install spend, and they behave very differently:
- Apple Ads (formerly Apple Search Ads), intent-driven placements inside the App Store. Highest conversion rates in mobile because the user is already in a downloading mindset.
- Google App Campaigns (UAC), automated buying across Search, Play, YouTube and Display. Huge reach, minimal manual control.
- Meta, interruption-based, driven almost entirely by creative. Strong for broad consumer apps with visual hooks.
- TikTok, fastest creative decay of the four, highest ceiling when a concept lands.
The practical distinction is intent versus interruption. Apple Ads and UAC Search capture people already looking. Meta and TikTok interrupt people doing something else. That difference dictates creative, budget pacing, and how quickly you can read results.
What Does Mobile App Advertising Cost in 2026?
| Category | Apple Ads cost per tap | Notes |
|---|---|---|
| Sports | $14.41 | The most expensive vertical in the store |
| Finance & Fintech | $3.00 - $6.06 | Subscription LTV generally supports it |
| Medical & Health | $1.50 - $4.45 | Wide spread by sub-category |
| E-commerce & Shopping | $1.20 - $3.00 | Q4 inflation is steep |
| Productivity & Utilities | $0.80 - $2.50 | Freemium conversion is the real gate |
| Hyper-casual games | $0.30 - $0.80 | Ad revenue per DAU decides viability |
| Religion | $0.24 | The cheapest measured category |
The all-category global median is $0.92, and the top-15-category average sits at $2.25, rising to roughly $1.51 in Q4 as holiday advertisers bid up inventory. Sources: AppTweak, Adapty (90 countries), Business of Apps.
A 60x gap between the cheapest and most expensive category is the single most important fact in app advertising budgeting. Benchmark against your category, never against the global mean.
Which Network Should You Start With?
| Situation | Start with | Reasoning |
|---|---|---|
| Under 1,000 installs | Apple Ads, exact match | Cheapest high-intent volume; needs no creative library |
| Proven conversion, want scale | Add Google UAC | Needs conversion volume to exit learning phase |
| Strong visual hook | Add Meta or TikTok | Creative-led; expect fast fatigue |
| Budget under $5,000/mo | One network only | Splitting starves every algorithm of signal |
The most expensive mistake is launching everywhere simultaneously on a small budget. Each network needs a threshold of conversions before its algorithm optimises. Four half-fed campaigns underperform one properly funded one, every time.
What We See Managing App Ad Budgets
- Brand defence is the cheapest inventory in mobile. Exact-match campaigns on your own app name typically run 60-80% below category cost per tap. Competitors bid on your name whether or not you do, so declining to defend it means paying for the install twice: once when they take it, and again when you re-acquire the user.
- Broad match without negatives leaks budget indefinitely. Weekly search-term review and disciplined negative keywords usually recover 15-30% of wasted spend inside the first month. This is unglamorous and it is where most of the savings live.
- Creative beats bidding. Ad auctions price partly on relevance, so a higher tap-through rate lowers effective cost. Reordering screenshots or changing a video's first two seconds moves performance more reliably than a bid increase.
- Learning phases punish impatience. Changing budgets or targeting mid-learning resets the algorithm. The instinct to intervene on day three is the most common cause of campaigns that never stabilise.
How Do You Know If It Is Working?
Cost per install tells you almost nothing on its own. These are the metrics that decide whether spend is profitable:
- Cost per paying user, the only acquisition metric that maps to revenue. A $6 tap converting at 60% into a $180 subscriber beats a $0.55 tap that never monetises.
- Day-7 and day-30 retention by cohort and source, sources differ enormously in user quality. Blended retention hides which network is buying you churn.
- Return on ad spend at a fixed window, pick 30, 60 or 90 days and hold it constant. Comparing a 90-day ROAS to a 7-day one is how agencies flatter results.
- Incrementality, post-ATT, deterministic iOS attribution is limited. Geo holdouts and spend-pause tests tell you what paid is genuinely adding versus taking credit for.
Privacy, ATT, and What Changed for Measurement
Apple's App Tracking Transparency broke the deterministic user-level attribution the industry was built on. SKAdNetwork returns aggregated, delayed, and partly obscured conversion data, which has three practical consequences:
- Campaign structures need to be simpler, because you have fewer conversion values to allocate across them.
- Read windows get longer. Judging an iOS campaign at 48 hours is now guesswork.
- Modelled and incremental measurement matter more than dashboards claiming precise per-user paths.
Any partner promising exact per-user iOS attribution in 2026 is either misinformed or overselling.
How Should You Structure Campaigns?
Simpler campaign structures outperform complex ones in 2026, because post-ATT you have fewer conversion signals to distribute across them. The old approach of segmenting into dozens of tightly themed ad groups starves each one of the data its algorithm needs. Consolidate: one campaign per clear objective, with enough daily budget that each can accumulate conversions quickly enough to learn.
| Campaign | Purpose | Budget priority |
|---|---|---|
| Brand exact | Defend your own name | Fund first, always |
| Category exact | High-intent competitor and category terms | Second |
| Discovery / broad | Find new terms to promote to exact | Only with negatives in place |
| Competitor | Bid on rival app names | Once the first two are profitable |
Why Do Costs Rise Over Time?
Rising cost per install is usually creative fatigue rather than auction inflation, and the two have different fixes. Check tap-through rate first: if it is falling while your bid is unchanged, the creative has burned out with the audience and no bid adjustment will rescue it. If tap-through is stable but costs rose, that is genuine auction pressure, typically seasonal (Q4 is steepest) or a new competitor entering your category. Diagnosing the wrong one wastes budget in the wrong direction.
Frequently Asked Questions
How much should I spend on mobile app advertising? Enough for one network to reach its learning threshold, which usually means at least a few thousand dollars per month concentrated in a single channel. Below that, spend on ASO instead.
Is Apple Ads better than Google UAC? They serve different jobs. Apple Ads captures existing intent and converts best; UAC delivers reach and needs conversion volume to work. Most apps start with Apple Ads and add UAC once conversion data is stable.
Why is my cost per install rising? Usually creative fatigue, seasonal auction pressure (Q4 especially), or audience saturation. Check tap-through rate first: if it is falling, it is creative, not bidding.
Can I run app ads without an agency? Yes, on one channel with a modest budget. The case for an agency is coordination, when ASO findings should inform paid creative and retention data should inform bidding.
Where to Take This Next
If you want paid media run alongside store optimisation rather than in a separate silo, that is how our mobile user acquisition engagement works. For store visibility specifically, see ASO services, or the full app marketing agency offering.
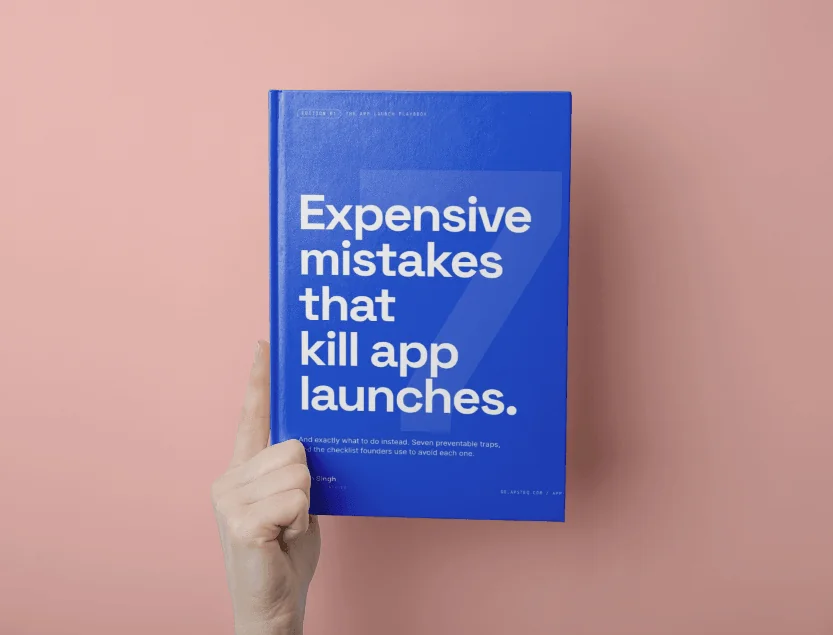
Free download
7 Expensive Mistakes That Kill App Launches
The launch errors we see most often across 300+ app engagements, and what to do instead.
Get the Free Ebook Browse all free guides